Byers, J.A. 1991. Simulation of mate finding behaviour in pine shoot beetles, Tomicus piniperda. Animal Behaviour 41:649-660.  pdf
pdf
 Abstract. An algorithm for animal searching behaviour was constructed
that allows independent variation of movement parameters such as speed, duration, step
size, and maximum right or left turn angle. The area, radius of the object
searched for, and number of objects and searchers can also be varied. A capture
algorithm is presented that can determine whether a searching animal intercepts
a circle (object) irrespective of the step size. These two algorithms were
Abstract. An algorithm for animal searching behaviour was constructed
that allows independent variation of movement parameters such as speed, duration, step
size, and maximum right or left turn angle. The area, radius of the object
searched for, and number of objects and searchers can also be varied. A capture
algorithm is presented that can determine whether a searching animal intercepts
a circle (object) irrespective of the step size. These two algorithms were
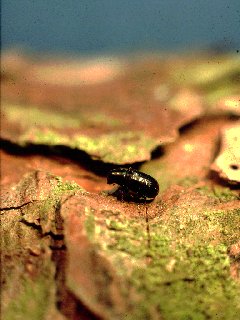
Female Tomicus piniperda searching for place to bore under bark flakes on a Scotch pine, Pinus sylvestris,
in April in southern Sweden.
See 
incorporated in a computer simulation model of mate finding for walking male
bark beetles, Tomicus piniperda, in search of females that remained stationary
when boring into the bark of Scots pine, Pinus sylvestris. The model showed
that, for realistically chosen parameters, males were able to find `females'
beyond the size of an actual female. This indicates that there may be little, if
any, advantage in the evolution of a long-range pheromone, for which no chemical
and behavioural evidence has yet been found.
Introduction
Simulation of animal movement is useful for understanding such areas of animal
behaviour as kinesis (Rohlf & Davenport 1969; Doucet & Drost 1985; Benhamou &
Bovet 1989), dispersal (Skellam 1973), and optimal searching for mates, prey,
food or oviposition sites (Jones 1976, 1977; Pyke 1978; Gries et al. 1989).
Models of search behaviour have concerned random movement in four (Rohlf &
Davenport 1969; Pyke 1978) or eight (Jones 1976, 1977; Gries et al. 1989)
possible directions. A more realistic model of animal movement in all possible
directions was diagrammed by Skellam (1973) for use in dispersal studies, but
was not implemented by computer. A recent model allows random changes in path
directions based on a normal distribution (Bovet & Benhamou 1988). In the
majority of these models a more natural movement was achieved by not allowing a
reversal of direction so that the `animal' generally progressed forward.
However, there have been few, if any, computer models that have realistically
simulated the relationships of animal movements and mate (or prey) finding in
bounded areas with respect to such parameters as speed, time, angle of turning,
size of mate or prey, rate of turning and density.
The model animal for my simulation study is the larger pine shoot beetle,
Tomicus piniperda (L.). This bark beetle (Coleoptera: Scolytidae) is a serious
pest of Scots pine, Pinus sylvestris L., in Europe and Asia. Its dispersal and
host-seeking flight coincides with temperatures above 13o C in early
spring (Byers et al. 1985; Lanne et al. 1987). Almost immediately at these
temperatures, T. piniperda aggregates en masse on fallen Scots pine that have
been damaged during winter storms. It is common to find several tens to hundreds
of beetles of both sexes walking about on the trunk. Females soon locate
suitable sites where they bore into the bark, but for several hours they are
exposed to predators (clerid beetles, Thanasimus formicarius). Also at this time
males wander in search of females that are boring into the bark. Upon
encountering a female a male attempts to monopolize her by jousting with and
displacing any resident male, during which time both males stridulate repeatedly
(personal observations). These interactions between males usually occur for only
a few seconds.
Bark beetles that aggregate en masse on host trees use pheromones (Byers
1989). An earlier study purported to find evidence of a long-range pheromone in
T. piniperda (Schönherr 1972) while another report was inconclusive (Kangas et
al. 1967). My colleagues and I (Byers et al. 1985) have demonstrated that T.
piniperda are attracted equally to traps containing either infested or
uninfested host logs in the field indicating that (1) there is no long-range
aggregation pheromone and (2) host compounds are responsible for aggregation. We
used chemical fractionation of odours collected from infested logs and bioassay
to isolate three host monoterpenes, (± )-alpha-pinene, 3-carene, and
terpinolene,
that were attractive when released at natural rates in the forest (Byers et al.
1985; Lanne et al. 1987). These monoterpenes are found in substantial amounts in
Scots pine oleoresin, which exudes from broken limbs and wounds on fallen trees.
Thus, this olfactory mechanism appears to account for the aggregation of
beetles. However, some question still remains as to whether T. piniperda uses
a long-range aggregation pheromone, since the previous studies used artificially
infested logs and thus may have confounded the natural behaviour. Also, a short-
range pheromone, operating after landing, might aid males in finding females.
Here, I present a mate-finding model which is simple in that it does not rely
on spatial memory or on long-range orientation of the animal. The searching sex
(male) is `captured' when an individual enters or intercepts the circular area
of the female. The model allows males to move in any direction at random, but
within limits, while other parameters, such as step size, remain constant during
the search period. However, movement parameters can be varied to test for their
effect on the efficiency of mate finding and the magnitude of encounters between
males. The angular degree of turning, rate of turning, speed of walking, period
of walking, radius of female, number of animals and the X,Y dimensions of the
area can be varied independently. By varying the radius of the female, for
example, it is possible to determine the radius at which the probability of
pairing during the time period is equivalent to natural pairing rates in nature.
This radius should then be similar to the effective radius of a female in
nature; if the simulated radius is significantly larger than the female then a
long-range attraction (olfactory, acoustic or visual) is indicated.
METHODS
Search Algorithm
The operational features of the algorithm are shown in Fig. 1.
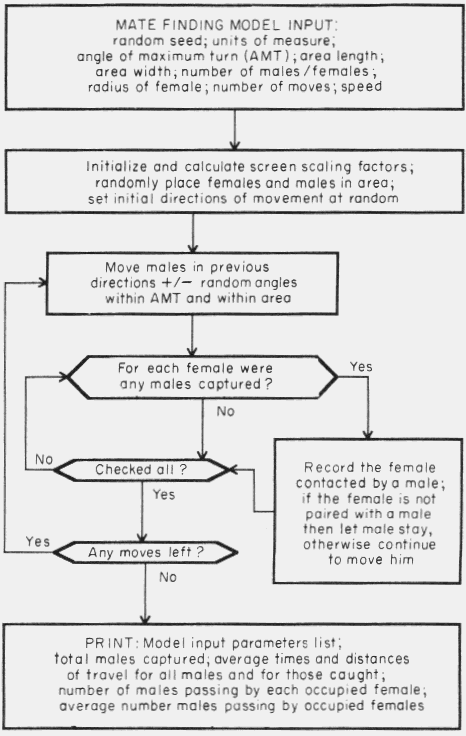
Figure 1. Flow diagram of computer program of simulation model of mate finding
by Tomicus piniperda.
One begins by entering values for the model variables such as the maximum right
or left turn angle and a radius for the `female' within which all `males' are
`captured'. According to the model, after each step the male may `choose' to take
the next step at any angle at random that is within the angle of maximum turn,
either right or left from the previous direction. The step size is specified
and remains the same throughout the simulation. Other parameters are the X- and Y-
lengths of the area and the number of male-female pairs. The number of moves
(steps) is calculated from the input variables of time (s), step length and
speed (i.e. speed x time / step size).
The program then places the females and males at random within the area and
sets the initial directions of males at random. The females remain stationary.
The males are then moved forward to new cartesian coordinates at each move based
on their previous direction plus an angle within the angle of maximum turn. If
the new coordinates are outside the area then a new direction is chosen at
random (± 360o) until the new coordinates are within the area.
Then for each female, all males are checked to determine if any have ventured
into, or
through, the effective attraction radius of the female. Males that have been
captured remain with the particular female throughout the rest of the simulation
and any later arriving males are not allowed to stay with the pair, although a
record of the encounters is kept.
Capture Algorithm
The algorithm for determining whether a male has been captured begins on
line 270 of the program (Fig. 2).
|
Fig. 2. Computer program in QuickBASIC 4.0 for the simulation model of mate
finding in walking bark beetles.
|
|---|
10 DIM X(400): DIM y(400): DIM J(400): DIM K(400): DIM P(400): DIM Q(400): DIM D(400): DIM U(400): DIM E(400)
20 SCREEN 9: CLS : PI = 3.1415926535892#: DG = .01745329251994#: DEFINT H, M-N, V
30 PRINT : PRINT "MATE FINDING MODEL": PRINT : INPUT "INPUT RANDOM SEED 1-100+"; SEED: SEED = RND(-SEED)
40 INPUT "INPUT UNITS OF MEASURMENT (cm or m etc.)"; CM$: INPUT "INPUT ANGLE OF MAXIMUM TURNING (DEGREES)"; AMT
50 PRINT "INPUT AREA LENGTH IN "; CM$; : INPUT L: PRINT "INPUT AREA WIDTH IN "; CM$; : INPUT W
60 INPUT "INPUT NUMBER OF FEMALES = MALES"; N: PRINT "INPUT RADIUS OF FEMALE/PREY IN "; CM$; : INPUT R
70 INPUT "INPUT SECONDS OF WALKING"; TT: PRINT "INPUT SPEED ("; CM$; "/SEC.)"; : INPUT CS
80 PRINT "INPUT STEP SIZE IN "; CM$; : INPUT S: INPUT "INPUT 1 FOR RESULT PRINTOUT"; PRT
90 T = TT * CS / S: D = S + R: CLS : LOCATE 15, 70: PRINT "MOVES:": LOCATE 16, 70: PRINT T
100 XA = L: YA = W: BP = 26: XL = 540: yl = 350: 'yl = 480: 'YL = 350
110 IF YA = XA THEN XC = XL / XA: YC = yl / YA: XS = XL - 1: YS = yl - 1
120 IF YA > XA THEN YC = yl / YA: XS = XL * XA / YA: YS = yl - 1: XC = XL / YA
130 IF XA > YA THEN XC = XL / XA: XS = XL - 1: YS = yl * YA / XA: YC = yl / XA
140 FOR X = 0 TO XS + .1 STEP XS: LINE (X, yl - YS - 1)-(X, yl - 1), 15: NEXT: FOR y = 0 TO YS + .1 STEP YS
150 LINE (0, yl - (YS - y + 1))-(XS, yl - (YS - y + 1)), 15: NEXT: PAINT (XS + 1, yl - 1), 1, 15
160 LOCATE 1, 70: PRINT "MATING"; : LOCATE 2, 70: PRINT "Tomicus";
170 FOR H = 1 TO N: J(H) = RND * (L - 1) + 1
180 K(H) = RND * (W - 1) + 1: CIRCLE (J(H) * XC, yl - K(H) * YC), R * XC, 12: NEXT
190 FOR H = 1 TO N: X(H) = RND * (L - 1) + 1: y(H) = RND * (W - 1) + 1
200 PSET (X(H) * XC, yl - y(H) * YC), 15: E(H) = RND * 360: NEXT
210 REM - MOVE SEARCHERS (MALES) WITHIN BOUNDARIES OF AREA
220 FOR H = 1 TO N - M: RL = RND * 2 - 1: E(H) = E(H) + RL * AMT: IF E(H) > 360 THEN E(H) = E(H) - 360
230 IF E(H) < 0 THEN E(H) = E(H) + 360
240 P(H) = S * COS(E(H) * DG) + X(H): IF P(H) > L OR P(H) < 0 THEN E(H)= RND * 360: GOTO 240
250 Q(H) = S * SIN(E(H) * DG) + y(H): IF Q(H) > W OR Q(H) < 0 THEN E(H)= RND * 360: GOTO 240
260 PSET (X(H) * XC, yl - y(H) * YC), 0: PSET (P(H) * XC, yl - Q(H) * YC), 15: NEXT: GOTO 270
270 V = 0: REM - CHECK TO SEE IF ANY SEARCHERS (MALES) ARE CAPTURED
280 V = V + 1: aq$ = INKEY$: IF aq$ < > "" THEN END
290 FOR H = 1 TO N: IF J(H) < P(V) - D OR J(H) > P(V) + D OR K(H) < Q(V) - D OR K(H) > Q(V) + D THEN 370
300 a = SQR((X(V) - J(H)) ^ 2 + (y(V) - K(H)) ^ 2): B = SQR((X(V) - P(V)) ^ 2 + (y(V) - Q(V)) ^ 2)
310 C = SQR((P(V) - J(H)) ^ 2 + (Q(V) - K(H)) ^ 2): IF a = 0 THEN a = .00001 ELSE IF B = 0 THEN B = .00001
320 ZZ = ((a ^ 2) + (B ^ 2) - (C ^ 2)) / (2 * a * B)
330 IF ZZ > .99999 THEN ZZ = .99999 ELSE IF ZZ < -.99999 THEN ZZ =-.99999
340 Z = (-ATN(ZZ / SQR(1 - ZZ * ZZ)) + PI / 2): IF Z > = PI / 2 THEN 370: REM 90 degrees
350 IF C < = R THEN 410
360 G = a * SIN(Z): FF = a * COS(Z): IF G < = R AND FF < B THEN 410
370 NEXT
380 IF V < N - M THEN 280 ELSE IF N = M THEN 460
390 FOR H = 1 TO N - M: X(H) = P(H): y(H) = Q(H): NEXT: I = I + 1: IF I > =T THEN 460
400 LOCATE 5, 72: PRINT I + 1; : GOTO 220
410 IF U(H) > 0 THEN 450
420 P(V) = P(N - M): Q(V) = Q(N - M): X(V) = X(N - M): y(V) = y(N - M): E(V) = E(N - M): D(H) = I + 1: IF V = N - M THEN 440
430 V = V - 1
440 M = M + 1
450 U(H) = U(H) + 1: GOTO 380
460 CLS : a$ = "MATING "
470 a$ = a$ + "Tomicus model": GOSUB 620: GOTO 480
480 a$ = "Length =" + STR$(L) + " Width =" + STR$(W) + " No. Moves" + STR$(T) + " Ma/Fe =" + STR$(N)
490 GOSUB 620: a$ = "Radius Fe/Prey =" + STR$(R) + " No. Seconds =" +STR$(TT) : GOSUB 620
500 a$ = "Step size =" + STR$(S) + " Speed =" + STR$(CS) + " Max. turn angle =" + STR$(AMT): GOSUB 620
510 a$ = "Dist. travelled up to" + STR$(T * S) + " " + CM$: GOSUB 620
520 FOR H = 1 TO N: IF U(H) > 0 THEN TOCM = TOCM + 1: TOMB = TOMB + U(H)
530 NEXT: FOR H = 1 TO N: AVET = AVET + D(H): NEXT: a$ = "Total males caught =" + STR$(TOCM): GOSUB 620
540 a$ = "Ave. No. males by female =" + STR$((TOMB - TOCM) / N): GOSUB 620: IF TOCM > 0 THEN 550 ELSE 590
550 a$ = "Ave. time to catch of those caught =" + STR$(AVET / TOCM * S / CS) + " s": GOSUB 620
560 a$ = "Ave. time to catch for all N =" + STR$(((AVET * S / CS) + (N - TOCM) * TT) / N) + " s": GOSUB 620
570 a$ = "Ave. distance of male travel of those caught = " + STR$(AVET / TOCM * S) + " " + CM$: GOSUB 620
580 a$ = "Ave. distance of male travel for all N =" + STR$(((AVET * S) + (N - TOCM) * T * S) / N) + " " + CM$: INPUT "press any key to continue"; y$
590 GOSUB 620: a$ = "Female no. No. males by Time of first male catch": GOSUB 620
600 FOR H = 1 TO N: a$ = STR$(H) + STRING$(12, 32) + STR$(U(H)) + STRING$(14, 32)
610 a$ = a$ + STR$(D(H) * S / CS): GOSUB 620: NEXT: GOTO 630
620 PRINT a$: IF PRT = 1 THEN LPRINT a$: RETURN ELSE RETURN
630 a$ = INKEY$: IF a$ = "" THEN 630
|
In the interest of execution speed, the position of the male in question is
compared first to the female's position to see if the X- or Y-distance between
them is greater than the sum of the female's radius and
the male's step size; if so, then the male cannot be caught. The law of cosines
is then used to calculate the angle between the line A, from the previous
coordinates (X,Y) to the female (J,K), and the line B, from (X,Y) to the new
coordinates (P,Q; Fig. 3).
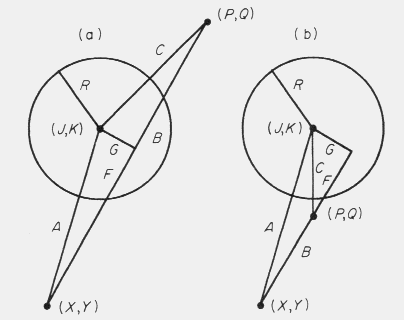
Figure 3. Geometric representation of the "capture" algorithm for two cases. In
the circle on the left, a male steps along (B) from (X,Y) to (P,Q) by passing
through the female (J,K) with circle of radius "R" and thus is caught. In the
circle on the right, a male takes a shorter step to (P,Q) in the same direction
but is not caught since (P,Q) is outside the circle. See the text for more
details.
If this angle is equal to or greater than 90o then the male is moving
away from the female and cannot be caught. Obviously if the distance between the
male and female is less than the radius of the female then he is caught. However,
if the step size is large relative to the radius then one must be able to
determine whether the male could have intercepted the female.
In Fig. 3a, the circle has been intercepted by a male with a step from (X,Y)
to (P,Q). The angle calculated above (with the law of cosines) and side A are
used with the right triangle of sides A, G and F to determine the length of G
and F (line 360 in Fig. 2). If G is less than or equal to the radius R, and F is
less than the step size B, then the male was captured. A special case arises
when G is less than R, but F is greater than the step size B, as in Fig. 3b.
Here the male moves toward the female but does not intercept her.
Speed of Walking on Scots Pine
I determined appropriate speeds of walking for use in the simulation model
from experimental observations. I collected both sexes of T. piniperda as they
walked on Scots pine trunks (18 April 1986, Sjöbo, southern Sweden). They were
separated by sex and stored at 2o C for 3 days and then allowed to
warm for 1 h before I tessted their walking speed at constant temperatures of 10,
17.9, 23.4 and 28.8o C (± 0.2o C) at 700 lx and 65±
5% r.h. in an environmental chamber (12.6 m3, Karl Weiss). Several
males or females were released on a large freshly cut Scots pine log (24 cm
diameter x 80 cm) with relatively smooth bark (bark flakes but no deep crevices).
I used a stop watch to time a beetle as it walked from 3 to 6 cm while moving
continuously. After timing, the beetle was removed from the log.
Simulations
A simulation model was constructed from the two algorithms and implemented as
a computer program (Fig. 2) in QuickBASIC 4.0 (Microsoft Corp.) that works on
any IBM-compatible personal computer. The program, with little modification,
should run on other computers with Microsoft BASIC. An EGA (enhanced graphic)
video display is currently supported but other graphic displays can be used by
changing the variable YL on line 100 to appropriate values (e.g. 480 for VGA).
The graphical display is important for confirming that the simulation is
performing as desired.
The effects of increasing male's speed, female's radius, duration of male's
walking, step size, angle of maximum right or left turn and density of male-
female pairs on the capture rate of males and the number of males passing per
female were determined in an area of 66 cm x 500 cm (a `trunk' section 21 cm
diameter by 5 m). The number of males passing per female does not include the
count for the first male-female pairing, and is thus equal to the number of
interactions between resident, `guarding', males and later arriving males. For
all simulations, except for the variable of interest, the male step size was 5
cm, speed 0.4 cm/s, angle of maximum turn 30o, duration of walking 5
h and 50 male-female pairs (15 pairs/m2). These model parameters were
chosen because they appear close to general observations of search movements of
males in the field. For example, an approximate walking speed of 0.4 cm/s is
expected on a `warm' swarming day. I have observed densities of 50 males and 50
females, and often more, per 5-m trunk section (sex ratios are 1:1, Salonen et
al. 1968). Each simulation was repeated at least four times. Best fit least
squares regressions were performed on the simulated results in order to determine
the mathematical relationships and data variation.
RESULTS
The walking speeds of male and female T. piniperda increased linearly with
temperature and were about the same at each temperature (Fig. 4).
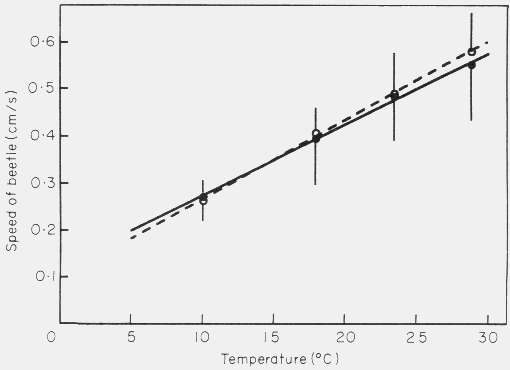
Figure 4. Effect of temperature on the speed of walking of male (solid line) and
female (dashed line) Tomicus piniperda on the bark of Scots pine. The temperature
coefficient, Q10, indicates the increase in walking speed
over a ten degree temperature range. The bars represent 95% confidence intervals
(n = 9-18).
The Q10, temperature coefficient, was about 1.6, i.e. for
a 10o C rise in temperature the speed of walking increased 1.6 times. A speed of
0.4 cm/s, used in most simulations, corresponds to 17.9o C which is
a normal temperature during the day of swarming flight. The effect of increasing
the male's walking speed on the percentage of males pairing also followed an
asymptotic (hyperbolic) relationship (Fig. 5).
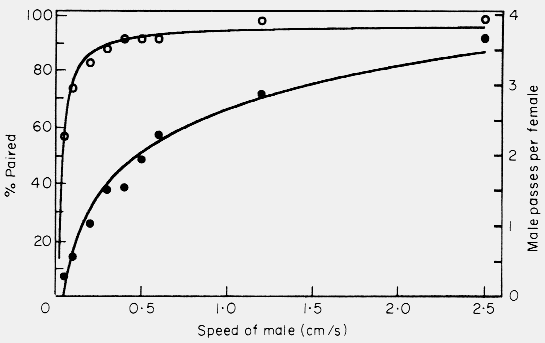
Figure 5. Effect of varying the male walking speed in the simulation model on the
mate finding success (percent paired, open circles) and on the male passes per
female (male-male interactions, filled circles). Model parameters were: 50 of
each sex in area of 500 x 66 cm, 0.5 cm female radius, 30o maximum
angle of male turning, 5 h of male walking, and 5 cm step size of male. Points
represent average of 4 to 8 simulations.
The relation indicates that even at speeds expected at cool temperatures (0.2
cm/s) a male would have a good chance of finding a
female. At speeds that were higher than expected, or even not possible, there
was little increase in pairing rates over the searching period. The rate of
males interacting with male-female pairs (interactions between males) increased
as a logarithmic function (Fig. 5). I use the term interactions between males
only to describe the occasions when a male meets an `occupied' female.
The effect of increasing the effective female radius from .03125 to 4 cm on
the probability of pairing as well as the number of male passes per female
(interactions between males) within the 5-h period of simulation is shown in
Fig. 6.
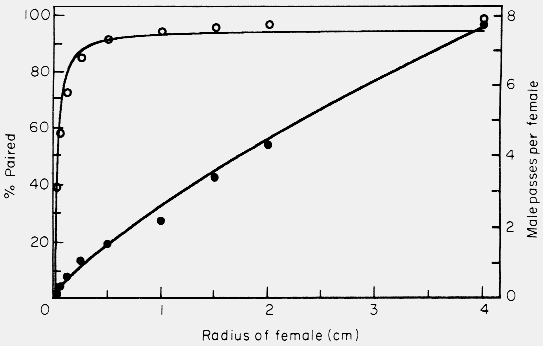
Figure 6. Effect of varying the female radius in the simulation model on the mate
finding success (percent paired, open circles) and on the male passes per female
(male-male interactions, filled circles). Model parameters were: 50 of each sex
in area of 500 x 66 cm, 0.4 cm/sec. male walking speed, 30o maximum
angle of male turning, 5 h of male walking, and 5 cm step size of male. Points
represent average of 4 to 8 simulations.
A hyperbolic function was evident for the percentage of males, or females, paired
and indicates that under the model's assumptions, which
attempted to simulate natural conditions, a radius of only 0.25 cm would capture
85% of the males (Fig. 6). This radius is about the physical size of a female
and indicates that males could readily find females without the need for a long-
range pheromone, simply by blundering into her. At radii much larger than a
female there is little increase in the success rate of finding a female. On the
other hand, the number interactions between males increases as an exponential
function that is approximately linear (Fig. 6).
As the duration of male searching was increased there was a rapid increase in
success at finding a mate (Fig. 7).
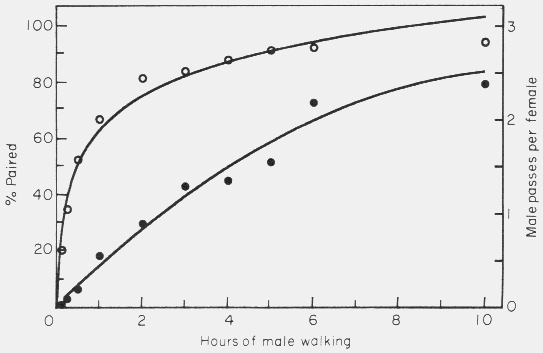
Figure 7. Effect of varying the male walking period in the simulation model on
the mate finding success (percent paired, open circles) and on the male passes
per female (male-male interactions, filled circles). Model parameters were: 50
of each sex in area of 500 x 66 cm, 0.5 cm female radius, 0.4 cm/sec. male
walking speed, 30o maximum angle of male turning, and 5 cm step size
of male. Points represent average of 4 to 8 simulations.
The majority of males were successful at finding a female after just a few hours
using model parameters that were assumed to be natural. The rate of interactions
between males was approximately linear with respect to time over the first 6 h.
The step size had practically no effect on the percentage paired (Fig. 8).
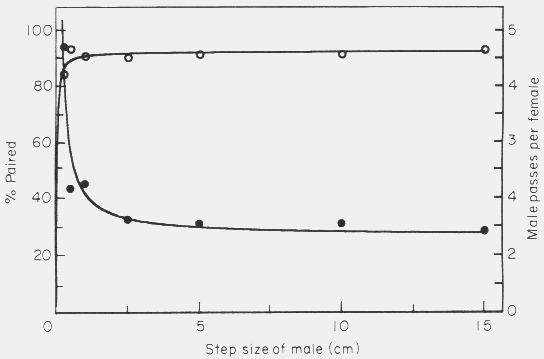
Figure 8. Effect of varying the male step size in the simulation model on the
mate finding success (percent paired, open circles) and on the male passes per
female (male-male interactions, filled circles). Model parameters were: 50 of
each sex in area of 500 x 66 cm, 0.5 cm female radius, 0.4 cm/sec. male walking
speed, 30o maximum angle of male turning, and 5 h of male walking.
Points represent average of 4 to 8 simulations.
For example, at a small step of 0.25 cm, and consequently many turns, 84.5% of
the males were captured and this remained relatively constant at any step size
up to 15 cm where 93% were caught. The rates of male interactions with male-
female pairs (interactions between males) were also relatively constant at ranges
of step size from 0.5 cm to 15 cm. Only at a very small step size of 0.25 cm was
the rate high (Fig. 8).
The angle of maximum right or left turn had no significant effect on the
male's ability to find females (Fig. 9).
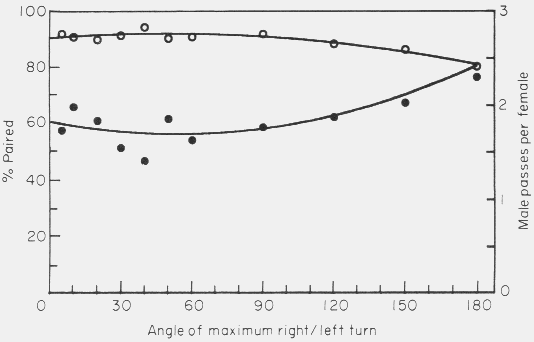
Figure 9. Effect of varying the angle of maximum right or left turn of the male
in the simulation model on the mate finding success (percent paired, open
circles) and on the male passes per female (male-male interactions, filled
circles). Model parameters were: 50 of each sex in area of 500 x 66 cm, 0.5 cm
female radius, 0.4 cm/sec. male walking speed, 5 h of male walking, and 5 cm step
size of male. Points represent average of 4 to 8 simulations.
There was a small increase in interactions with paired beetles at the nearly
random movement pattern (180o). The number of males and females per
area was varied over expected natural densities (Fig. 10).
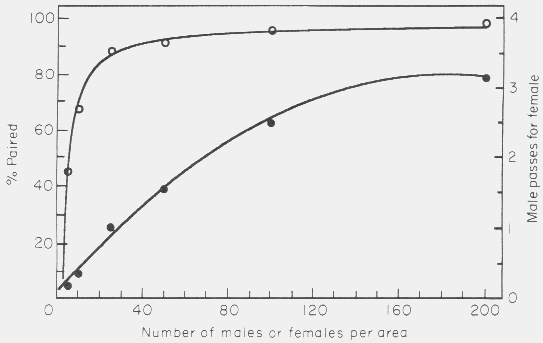
Figure 10. Effect of varying the number of male-female pairs per area (density)
in the simulation model on the mate finding success (percent paired, open
circles) and on the male passes per female (male-male interactions, filled
circles). Model parameters were: 500 x 66 cm area, 0.5 cm female radius, 0.4
cm/sec. male walking speed, 5 h of male walking, and 5 cm step size of male.
Points represent average of 4 to 8 simulations.
A small increase in density caused a rapid increase in the ability of any
particular male to find a female. At densities that are commonly observed, 25 or
50 pairs/area (7-15 pair/m2), the success of pairing had reached 88.5%
and 91.5%, respectively. The interaction rate between males increased
approximately linearly over densities of 5 to 100 pairs per area (Fig. 10).
DISCUSSION
The colonization of a tree usually occurs in a few afternoon flights that may
not necessarily be on successive days. Thus by the next morning after each
aggregation on the trunk the female-male pairs have bored into the bark. The
final attack density can range from about 50, or less, up to 300/m2
(Nilssen 1978; Lĺngström & Hellqvist 1988). The placement of males at random in
the model is realistic but in nature females are actually somewhat over-dispersed
in their spatial distribution (Nilssen 1978). However, this spatial pattern of
female attacks should have little, if any, effect on the mate-finding success or
rates of interactions between males compared with the random pattern used in
the model.
The speed parameter of 0.4 m/s is expected for males walking at 18o
C in the afternoon. The average speed of a male may actually be less as they
probably stop occasionally and also take time contesting males that are guarding females.
However, even at slower speeds in the model, `males' had little difficulty
finding females (Fig. 5). The 5-hr period of searching used in the model is
reasonable if the male landed in the afternoon and searched until dusk. However,
in reality males may search even longer, such as through the night (although not
observed) and during the next morning. I have seen beetles walking in the
morning when temperatures were well below 12o and thus precluded
flight.
The angle of maximum right or left turning of 30o used in most
simulations appears reasonable when one observes the tracks on the video display
and
compares these with walking beetles in nature. The natural turning angle
probably has some normal distribution about the previous direction (Bovet &
Benhamou 1988; Benhamou & Bovet 1989) instead of the uniform random distribution
used here. The angular distribution would also probably be influenced by the
`roughness' of the bark, a rougher bark causing more detours. Fine tuning of
this parameter, however, may not improve our understanding of mate finding in
the present model since the angle had practically no effect (Fig. 9) even when
its distribution changed from ± 5o (nearly straight path) to ±
180o (completely random path). This is surprising until one considers
that when males strike the boundaries of the area they change directions at
random. There is a real border on the longer sides of the area since the fallen
pine is laying on the ground
and beetles prefer to remain on the exposed bark. The slight increase in
interactions between males as the angle of maximum turn is increased to
180o may be due to repeated re-entries of males into pairs because of
the possibility of reversing direction at 180o (Fig. 9). In nature,
males do not appear to avoid areas previously visited.
The step size of an insect is not a discrete parameter, as has been discussed
by Benhamou & Bovet (1989), but can be used, together with the angle of maximum
turn, to simulate animal movement paths explicitly. The step size is inversely
proportional to the frequency of turns. At very small step size, or very high
turning frequency, the male essentially simulates Brownian motion and thus
traverses only short spaces and pairing rates are consequently low. On the other
hand, a male near a pair would probably collide several times during the short
circling motions and consequently there would be many male passes per female
(Fig. 8). Increases in step size rapidly allow efficient mate finding and
further increases seem to have little effect under the model's constraints. A
male appears to travel at least 1 cm before changing direction under natural
conditions. In the model, even at steps of 0.25 cm, considered quite small, the
males still found 84.5% of the females while at 0.5 cm steps 93.5% were found.
Larger steps produced no significant change in mate-finding efficiency (Fig. 8).
The effects of aggregation density on mate-finding success were significant at
low densities but by the time 25 pairs had landed the expected probability for
a male to find a female in the 5-h period was up to 88.5% (Fig. 10).
The effective radius of the female is the radius within which a male is
captured. This is similar to Smith's (1973) `zone of danger' for prey items or
the `effective attraction radius' for a pheromone (Byers et al. 1989a). The
circle catches 100% of the males so the natural radius would be somewhat larger
and not necessarily circular. When T. piniperda males encounter females that are
walking they make no attempt to chase them and seem oblivious. When males
encounter stationary females they appear to veer into them at a very short
distance (< 0.5 cm) and touch them and then may attempt to mate from behind
or simply press the head against the female's elytral apex. It seems
reasonable that radii of 0.5 cm in the model allowed 91.5% pairing or even 85% at only a
0.25 cm radius, the female size (Fig. 6).
At higher densities the pairing rate would be higher still (Fig. 10), while
at lower densities the males would require more time to find a mate (Figs. 7,
10). The results account for pairing rates observed in nature where in early
afternoon the majority of beetles are single but by evening the majority have
paired, although many beetles of both sexes are still walking about. The high
mate finding success rate in the model using a range of `natural' parameters
indicates that T. piniperda females do not require a long-range pheromone to
attract males after they land. A long-range pheromone might increase slightly
mate acquisition under low population levels; however, at most levels there
would not be a significant selection pressure for evolution (or maintenance) of
a pheromone system considering the significant attraction to host-tree odours
(Byers et al. 1985, 1989b). The expected energy cost of maintaining a pheromone
system and the possibility of increased apparency to predators, who might evolve
a kairomone response to a long-range pheromone, argue against selection for
pheromone-producing females.
Other bark beetles that aggregate en masse on their host tree use long-range
pheromones (Byers 1989). The western pine beetle, Dendroctonus brevicomis, of
North America has a monogamous mating system in which the male joins the female
in her gallery system but in this case the male responds to an aggregation
pheromone (Silverstein et al. 1968). In this species, however, colonization of
the tree begins with one female so initially densities are quite low in
comparison with T. piniperda. Using model parameters as above but for D.
brevicomis in an area 100 times greater (i.e. lower density) and a female radius
of 0.5 cm, only 10% of the males find females while at a radius of 32 cm about
77% find females. Thus, at the densities expected during initial colonization
for bark beetles using long-range pheromones it would be clearly advantageous
for beetles to orient to an odour source (gallery entrance) while walking. That
beetles may do this in nature has been observed with several species in the
laboratory (Lanne et al. 1987; Byers 1989). However, the results of the present
study indicate that at higher densities, when colonization has progressed and
pheromone is emanating from may points with consequent sensory adaption, beetles
can find gallery systems simply by interception during directed random walks.
Optimal foraging theory is concerned with decision rules for staying and
leaving and with movement between resource `patches' (Pyke 1984). Here male T.
piniperda are searching for mates within a patch consisting of a fallen Scots
pine that is susceptible to attack and releasing attractive monoterpenes (Byers
et al. 1985). Standing trees are rarely attacked since the beetle is not able to
cope with resin flow as readily as other more "aggressive" bark beetles
(Lĺngström & Hellqvist 1988; Byers 1989) and because these trees do not have
wounds that could release appreciable levels of monoterpenes. Window traps on
dead trees fallen in previous years do not catch beetles compared with recently
fallen, living trees (Byers et al. 1989b, Byers unpublished data). The fallen
tree patches would be expected to be randomly dispersed throughout the forest.
A male's decision whetherto fly away from a particular patch in search of
another should depend on the density of unpaired females. A long search time
without encountering any females would indicate that the probability of finding
a female was low and it might be advantageous to seek another patch with a
higher female density. A high rate of encountering male-female pairs by a
searching male would indicate a high degree of potential competition among
several larval broods of neighbouring pairs which may occur under the bark
(Byers 1984; De Jong & Saarenmaa 1985). Thus it would be advantageous to fly to
another patch.
Before a female chooses an attack site she is also seen to search as males
do. However, upon encountering either a female boring alone or a pair she walks
away from the area, most likely to avoid potential future competition for her
larvae (De Jong & Saarenmaa 1985). This behaviour could be part of the mechanism
that leads to a spacing apart of attacks on the bark as observed previously
(Nilssen 1978; Byers 1984). A high rate of these interactions should cause her
to decide to search for another patch, while a low rate should induce her to
stay. At suitable temperatures during the aggregation beetles commonly both land
and take flight. For example, I observed at least 14 beetles taking flight from
an 8-m section of trunk in 5 min, and all but two flew more than 10 m away
before I lost sight of them. As the colonization progresses over several days,
verbenone (a ketone of alpha-pinene) is released and causes both sexes to avoid
attacked areas since the beetles are less attracted to the monoterpenes when
verbenone is present (Byers et al. 1989b). Thus, since the beetles contain
verbenone (Lanne et al. 1987) it may function at close-range in the spacing of
attacks and limiting competition while signalling later in the colonization,
before landing and at long-range, that the host is becoming unsuitable for
reproduction (Byers et al. 1989b).
The capture algorithm should prove useful in models of predator-prey
interactions, host and mate finding, and trapping of insect or animal
populations. The model can be used to explore many variations of the parameters
discussed above to fit a wide variety of animal systems. The graphical display
allows for immediate confirmation of the model's proper functioning and
illustrates the principles to students and researchers alike.
ACKNOWLEDGMENTS
This work was supported in part by a research stipend from Hildur and Sven
Wingqvists Stiftelse, Sweden. I thank F. Schlyter, S. Bensch and the anonymous
referees for commenting on the manuscript.
REFERENCES
Benhamou, S. & Bovet, P. 1989. How animals use their environment: A new look at
kinesis. Anim. Behav., 38, 375-383.
Bovet, P. & Benhamou, S. 1988. Spatial analysis of animals' movements using a
correlated random walk model. J. Theoret. Biol., 131, 419-433.
Byers, J.A. 1984. Nearest neighbor analysis and simulation of distribution
patterns indicates an attack spacing mechanism in the bark beetle, Ips
typographus (Coleoptera: Scolytidae). Environ. Entomol. 13, 1191-1200.
Byers, J. A. 1989. Chemical ecology of bark beetles. Experientia 45, 271-283.
Byers, J. A., Anderbrant, O. & Löfqvist, J. 1989a Effective attraction radius:
a method for comparing species attractants and determining densities of
flying insects. J. Chem. Ecol. 15, 749-765.
Byers, J.A., Lanne, B.S., & Löfqvist, J. 1989b. Host-tree unsuitability
recognized by pine shoot beetles in flight. Experientia 45, 489-492.
Byers, J. A., Lanne, B. S., Schlyter, F., Löfqvist, J. & Bergström, G. 1985.
Olfactory recognition of host-tree susceptibility by pine shoot beetles.
Naturwissenschaften 72, 324-326.
De Jong, C. M. M. & Saarenmaa, H. 1985. A mechanistic simulation model for the
movement and competition of bark beetle larvae (Coleoptera, Scolytidae).
Ecol. Mod. 27, 109-138.
Doucet, P. B. & Drost, N. J. 1985. Theoretical studies on animal orientation.
II. Directional displacement in kineses. J. Theoret. Biol., 117, 337-361.
Gries, G., Nolte, R. & Sanders, W. 1989. Computer simulated host selection in
Ips typographus. Entomol. Exp. Appl. 53, 211-217.
Jones, R. E. 1976. Search behaviour: A study of three caterpillar species.
Behaviour 60, 237-258.
Jones, R. E. 1977. Movement patterns and egg distribution in cabbage
butterflies. J. Anim. Ecol. 46, 195-212.
Kangas, E., Perttunen, V. & Oksanen, H. 1967. Studies on the olfactory stimuli
guiding the bark beetle Blastophagus piniperda L. (Coleoptera, Scolytidae)
to its host tree. Ann. Ent. Fenn. 33, 181-211.
Lĺngström, B. & Hellqvist, C. 1989. Scots pine resistance against Tomicus
piniperda as related to tree vitality and attack density. In: Integrated
Control of Scolytid Bark Beetles (Ed. by T. L. Payne & H. Saarenmaa), pp.
121-133. Virginia Polytech. Press, Blacksburg.
Lanne, B. S., Schlyter, F., Byers, J. A., Löfqvist, J., Leufvén, A., Bergström,
G., Van Der Pers, J. N. C., Unelius, R., Baeckström, P. & Norin, T. 1987.
differences in attraction to semiochemicals present in sympatric pine shoot
beetles, Tomicus minor and T. piniperda. J. Chem. Ecol. 13, 1045-1067.
Nilssen, A. C. 1978. Spatial attack pattern of the bark beetle Tomicus piniperda
L. (Col., Scolytidae). Norw. J. Entomol. 25, 171-175.
Pyke, G. H. 1978. Are animals efficient harvesters? Anim. Behav. 26, 241-250.
Pyke, G. H. 1984. Optimal foraging theory: A critical review. Ann. Rev. Ecol.
Syst. 15, 523-575.
Rohlf, J. F. & Davenport, D. 1969. Simulation of simple models of animal
behavior with a digital computer. J. Theoret. Biol., 23, 400-424.
Salonen, K., Pulliainen, E. & Koponen, M. 1968. Sex ratios in Blastophagus
piniperda L. (Col., Scolytidae) in Finland. Ann. Ent. Fenn. 34, 31-37.
Schönherr, J. 1972. Pheromone beim Kiefern-Borkenkäfer "Waldgärtner,"
Myelophilus piniperda L. (Coleopt., Scolytidae). Z. Angew. Entomol., 71,
410-413.
Silverstein, R. M., Brownlee, R. G., Bellas, T. E., Wood, D. L. & Browne, L. E.
1968. Brevicomin: Principal sex attractant in the frass of the female western
pine beetle. Science 159, 889-891.
Skellam, J. G. 1973. The formulation and interpretation of mathematical models
of diffusionary processes in population biology. In: The mathematical theory
of the dynamics of biological populations (Ed. by M. S. Bartlett & R. W.
Hiorns), pp. 63-85. London: Academic Press.
Smith, J. N. M. 1973. The food searching behaviour of two European thrushes. II:
The adaptiveness of the search patterns. Behaviour 59, 1-59.