Byers, J.A. 2004. Equations for nickel-chromium wire heaters of column transfer lines in gas chromatographic-electroantennographic detection (GC-EAD). Journal of Neuroscience Methods 135:89-93.  pdf
pdf

 Abstract.
Heating of chromatographic columns, transfer lines, and other devices is often required in neuroscience research. For example, volatile compounds passing through a capillary column of a gas chromatograph (GC) can be split, with half exiting the instrument through a heated transfer line to an insect antenna or olfactory sensillum for electroantennographic detector (GC-EAD) recordings. The heated transfer line is used to prevent condensation of various chemicals in the capillary that would otherwise occur at room temperature. Construction of such a transfer line heater is described using (80/20%) nickel-chromium heating wire wrapped in a helical coil and powered by a 120/220 V ac rheostat. Algorithms were developed in a computer program to estimate the voltage at which a rheostat should be set to obtain the desired heater temperature for a specific coil. The coil attributes (radius, width, number of loops, or length of each loop) are input by the user, as well as AWG size of heating wire and desired heater temperature. The program calculates total length of wire in the helix, resistance of the wire, amperage used, and the voltage to set the rheostat. A discussion of semiochemical isolation methods using the GC-EAD and bioassays is presented.
Abstract.
Heating of chromatographic columns, transfer lines, and other devices is often required in neuroscience research. For example, volatile compounds passing through a capillary column of a gas chromatograph (GC) can be split, with half exiting the instrument through a heated transfer line to an insect antenna or olfactory sensillum for electroantennographic detector (GC-EAD) recordings. The heated transfer line is used to prevent condensation of various chemicals in the capillary that would otherwise occur at room temperature. Construction of such a transfer line heater is described using (80/20%) nickel-chromium heating wire wrapped in a helical coil and powered by a 120/220 V ac rheostat. Algorithms were developed in a computer program to estimate the voltage at which a rheostat should be set to obtain the desired heater temperature for a specific coil. The coil attributes (radius, width, number of loops, or length of each loop) are input by the user, as well as AWG size of heating wire and desired heater temperature. The program calculates total length of wire in the helix, resistance of the wire, amperage used, and the voltage to set the rheostat. A discussion of semiochemical isolation methods using the GC-EAD and bioassays is presented.
Keywords: Transfer line heaters; Column heaters; Nickel-chromium wire; GC-EAD; Electroantennogram, Computer software, Helix, Semiochemicals
1. Introduction
An important technique in elucidating pheromones and other semiochemicals of insects is the gas chromatograph (GC) coupled with an electroantennographic detector (EAD, i.e., electrophysiological recordings of an insect antenna) termed the GC-EAD (Arn et al., 1975; Löfstedt et al., 1982; Van der Pers and Löfstedt, 1983; Baker et al., 1991; Henning and Teuber, 1992; Barata et al., 2000; Schlyter et al., 2000; Zhang et al., 2002). The EAD consists of an antenna placed between two electrodes from which an amplified signal is recorded by computer software. Instead of using the whole antenna, recording can also be made from single sensilla (Van der Pers and Löfstedt, 1983; Hansson et al., 1990; Steullet and Guerin, 1994; Dougherty et al., 1999). Usually the GC column effluent is split between the flame ionization detector (FID) and the EAD using a glass "Y-tube" splitter. The split necessarily reduces sensitivity by about one half for each detector but allows simultaneous comparisons. After the injection of a biological sample extract into the GC, any FID chemical signal that corresponded to an EAD peak signal would indicate the elution of a pheromone or other semiochemical. Later, an appropriate chemical standard can be compared by retention time and EAD signal.
A mass spectrometer detector (MS) could be used instead of the FID, but the MS vacuum would likely evacuate all the effluent such that none reaches the antenna. Therefore, a switching valve inside the oven can be used to direct the GC effluent either to the MS, for chemical identification, or to the splitter and FID/EAD detectors. However, the retention times of compounds detected by the MS under vacuum would likely be different from those in the positive pressure EAD/FID system.
In the GC-EAD system, the chemical effluent must be brought outside the instrument and directed into a tube of cooler humidified air in order to reach the antenna without burning it (Arn et al., 1975). The chemicals passing through the fused-silica capillary of the instrument oven, where the temperature can be several hundred degrees C, must not condense on the column walls upon emerging into the relatively cool air of the room. This is where a transfer line heater is employed to keep the GC capillary column at a constant and reasonably high temperature during transit from the oven to the emptying point in the humidified air stream. Such transfer lines and column heaters are commercially available but cost several hundred to over a thousand US dollars (e.g., Alltech Associates, Inc.; Supelco; Syntech). Furthermore, these column heaters are of specific sizes and may not meet the needs of some applications. The objective here was to formulate equations and incorporate them into a program to aid in constructing an inexpensive column heater. The user of the program would input desired variables for a heater coil, such as physical dimensions and operating temperature, and then calculate the voltage required on a laboratory rheostat to achieve the desired result. The second objective was to build a heated transfer line for the fused-silica capillary in a GC-MS/FID/EAD system and test the predictions of the programmed equations.
2. Methods
Nickel-chromium (Ni-Cr) wire (80/20%) of 22 AWG (American Wire Gauge) size (Omega Engineering, Inc, Stamford, CT; purchased from Newport Electronics, Inc., Santa Ana, CA) was used to construct the heater (Fig. 1). The helical coil was made by tightly wrapping a 1-ml glass pipette (4.8 mm OD, 2.5 mm i.d.) cut to 240 mm length. After winding the wire in 146 loops of about 2.7 mm radius (including AWG 22 wire radius) around the glass tube, the helix was pulled evenly apart to extend the full 240 mm of the pipette (each loop was then about 240/146 mm in length). A second glass tube 240 mm long and 8.4 mm i.d. was fitted around the coil for insulation. A third glass tube, 100 mm long and 13.8 mm i.d. (cut from a test tube) was fitted over one end of the glass tubes, while one end of the wire was inserted between the second and third outer tubes to prevent shorting on the metal GC cabinet. The wires (Fig. 1) were then connected to an extension cord with metal screw fasteners, and the extension cord was plugged into a standard laboratory rheostat (120/220 V ac Variac or comparable rated at 10 A or more). The coil and concentric glass tubes were wrapped with 20 m of ZETEX® insulating tape (25 mm wide x 0.75 mm thick; VWR International, Inc., West Chester, PA) to a thickness of 1.5 cm. The stainless steel sensor of an electronic thermometer rated to 300° C (VWR no. 77776-730) was held next to the glass tubes under the insulating tape to monitor heater temperature. A second heater with 75 loops, 134 mm length, and with a 4.5 mm radius was constructed similarly and tested with a digital thermometer (Control Company, Friendswood, Texas) whose probe was inserted inside the glass tube and surrounding coil.
Figure 1. A Ni-Cr wire coil powered by a 120/220 V ac rheostat heats a glass tube enclosing the fused-silica capillary column from the GC. The capillary enters a Teflon tube carrying humidified air to an insect antenna supported by electrodes for recording signals induced by pheromone effluents. See text for details.
A 20 mm diameter hole was bored in the outer GC cabinet so the heater could be inserted about 10 mm into the GC oven insulation. A smaller diameter hole was made through the oven insulation to allow a high-temperature, deactivated, fused-silica capillary (Alltech Associates, Inc., Deerfield, IL) to emerge and enter the heater. The capillary from the GC was run through the glass pipette and surrounding heater coil to insert and empty into in a 3.2 mm i.d. Teflon (TFE) tube with humidified air stream that carried the volatiles to an insect antenna and electrophysiological recording system (Syntech, P.O. Box 1547, NL-1200 BM Hilversum, The Netherlands).
3. Results
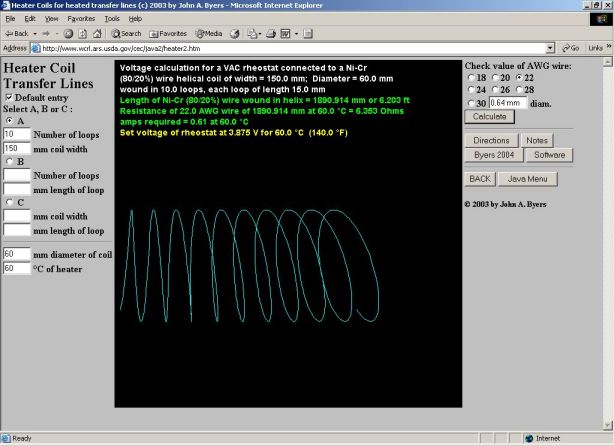
Equations were devised to calculate the approximate voltage at which to set the rheostat to obtain the desired temperature for a specified set of heater dimensions and wire size. The algorithms were coded in both QuickBASIC 4.5 (Microsoft Corp., Redmond, WA) and Java 2.1 (Sun Microsystems, Inc., Santa Clara, CA) programming languages for distribution on the Internet (www.wcrl.ars.usda.gov/cec/java2/java.htm). Any one of three input options is chosen and entered: (1) number of loops and width of helix, (2) number of loops and incremental length of each loop, or (3) width of helix and incremental length of each loop. The user is then instructed to enter the radius of the helix, the desired temperature of the heater, and the AWG wire size (18, 20, 22, 24, 26, 28, or 30). The program then calculates the output parameters, described subsequently, and draws a representation of a 3D helix in approximate scaled dimensions on the screen.
The length (L) of a helix space curve, depicted in x, y, z spatial coordinates, with radius (radius), width (width), and number of turns (loops), can be evaluated as a limit of lengths of arcs by vector functions in time (t) (Stewart, 1999):
 (1)
(1)
where p=3.141593, x(t) = radius x cos(2pt), y(t) = radius x sin(2pt), z(t) = width/loops x t, x'(t) = -2p x radius x sin(2pt), y'(t) = 2p x radius x cos(2pt), z'(t) = width/loops, and 0 <= t <= loops. The length of wire (L) in the helical coil is then:
(2)
The resistance of the Ni-Cr heater wire at operating temperature is given by the following equation:
(3)
where A = (AWG/2) - 8 = (1, 2, 3, 4, 5, 6, or 7) and R1 = 0.4062, R2 = 0.6348, R3 = 1.015, R4 = 1.609, R5 = 2.571, R6 = 4.094, R7 = 6.5; T = degrees in C; and L = length of wire used in helix in mm (calculated in Equation 2). Quadratic regression was used on table values of the manufacturer to calculate a factor that depends on the heated-wire temperature (T), as seen in the brackets of equation (3), that must be multiplied by the resistance (RA) of the particular AWG size of Ni-Cr wire at room temperature. The resistance is also proportional to the length of the wire in the helix (L).
The amperage (Amps) required to heat various AWG wire sizes of Ni-Cr wire was calculated using linear regression of table values of the manufacturer up to 750° C:
Amps = AAWG + BAWG x T
(4)
where the regression coefficients correspond to AWG wire sizes: A18 = -0.125, B18 = 0.0197; A20 = -0.076, B20 = 0.0145 ; A22 = -0.033 , B22 = 0.0107 ; A24 = -0.006 , B24 = 0.0079 ; A26 = 0.010 , B26 = 0.0059 ; A28 = 0.014, B28 = 0.0044; A30 = 0.016, B30 = 0.0033 for various AWG wire sizes. Equation (5) then is used to find the voltage at which to set the 120/220 V ac rheostat:
Volts = Ohms x Amps
(5)
AWG-22 wire wound in 75 loops in a helix 134 mm long with a radius of 4.5 mm had a measured resistance of 7.4 Ohms and was calculated to have a length of 2125 mm (equation 2). A current of 1.54 A and 11.4 V was calculated to obtain 150ş C in a straight bare wire of this length, and its resistance was calculated to be 7.3 Ohms. The voltage was adjusted to obtain temperatures from 50 to 250° for a bare coil and for the same coil insulated with about 1-cm thickness of ZETEX® tape. The predicted voltage necessary to reach a specific temperature with a straight wire was more than was required for a coil, since the coil's loops mutually interfere with the dissipation of heat (Fig. 2). The temperature difference between a straight wire and an insulated coil become even greater due to the retention of heat such that less energy (voltage) is required to maintain the desired temperature (Fig. 2). However, the differences from predicted values are only in the range of a few volts for temperatures under 200° C, which are needed for most heated transfer lines.
Figure 2. AC voltages required to attain heated temperatures in a 75-loop coil, 134 mm wide with a 4.5 mm radius, when bare or insulated with 1-cm thickness of ZETEX® tape. The voltage needed to reach the predicted temperature for a straight wire in air at room temperature is based on equations (2-5) for 22 AWG Ni-Cr wire.
4. Discussion
The GC-EAD and GC-sensillum methods are used in many chemical ecology laboratories to identify insect pheromones and stimulatory plant volatiles (Arn et al., 1975; Löfstedt et al., 1982; Van der Pers and Löfstedt, 1983; Hansson et al., 1990; Baker et al., 1991; Henning and Teuber, 1992; Barata et al., 2000; Schlyter et al., 2000; Zhang et al., 2002). The GC-sensillum has also been used to identify chemicals in mammalian odors that are attractive to ticks and sandflies (Steullet and Guerin, 1994; Dougherty et al., 1999). The coupling of GC with electrophysiology is a powerful technique that could be used to study responses of vertebrate olfactory sensilla to volatiles, however, a computer search of BIOSIS Previewsâ found no reports using the method.
In many previous studies, olfactory sensilla were exposed to odors by means of puffing syringe headspace air, saturated or partially saturated, with a chemical or mixture of components (Van der Pers, 1982; Hansson et al., 1991; Lanne et al., 1987; Baker et al., 1991). Due to the frequent dispensing of puffs from the syringe, the atmospheres often were not saturated, and in many cases the volatility of the compounds were not known. Thus, absolute molecular concentrations could not be described. If mixtures were used it became more complicated since volatiles compete for the vapor pressure, i.e., the concentrations in the headspace are proportional to the mole percentage of each component in the liquid phase according to Raoult's Law (Byers, 1988). This means that the headspace concentrations of individual components in mixtures are significantly reduced compared to when each is presented alone (Byers, 1981).
Many of the above problems are avoided by using the gas chromatograph, in which precise mixtures of compounds of known quantities can be passed to the insect antenna for measurement of electrical responses (Zhang et al., 2002). Although the precise concentration affecting the antenna is difficult to determine since a GC peak elutes over some seconds, at least the quantities presented are reproducible. The drawback of GC presentation of compounds to antennae is that the chemicals are presented individually as they elute so that synergism among compounds cannot be observed. However, at the peripheral level of receptor sites and axons of the insect antenna, there is little interaction between neurons (Hansson et al., 1992; Hansson, 1995). Therefore, a depolarization due to a single chemical would indicate the insect can detect the compound, but this chemical alone might not elicit a behavioral response. If the interest is in the interactions of neurons in the brain, then presentation of multiple chemicals by means of a syringe puff is desirable.
Due to its ease of use, the GC-EAD has nearly replaced the classical methods for isolating and identifying semiochemicals. The classical method involves chromatographic fractionation of biological extracts and then combinatorial presentation of the fractions in behavioral bioassays (Silverstein et al., 1967; Byers et al., 1990; Byers, 1992). It should be noted that the subtractive-combination method of fractionation and bioassay was proven to be more efficient than the additive-combination method in all possible schemes (Byers, 1992). Both methods, however, are very sensitive to synergistic combinations of two or more components. In contrast, there is the danger that synergistic semiochemicals have not been identified in studies because of the increasing preoccupation with GC-EAD that detects each component as it elutes. Background electronic noise, weak signals due to a minimal number of insect receptors for a particular component, and co-eluting quantities of weakly excitatory chemicals can mask and confound the isolation of semiochemicals. Some receptors that respond to a pheromone component are inhibited by similar compounds (Hansson et al., 1990). Thus, the elution of an inhibitor immediately before a stimulant might adversely affect the EAD signal. There is also the small possibility that synergism can occur at the peripheral level so that two component stimulation is required to elicit antennal response.
Electrical responses of antennae to a chemical do not necessarily indicate that the chemical would elicit the behavior of interest. In male moths, the antennae primarily have receptors tuned to only a few specific sex pheromone components that are attractive (Baker, 1989; Hansson, 1995; Roelofs, 1995; Byers, 2002), while in bark beetles (Lanne et al., 1987; Schlyter et al., 2000) and honey bees (Henning and Teuber, 1992) there are apparently numerous chemicals that cause electrical potentials, but not all compounds are attractive in behavioral bioassays. Still, even in insects with wider response ranges to chemicals, it seems the GC-EAD is the favorite method of isolation and identification of semiochemicals when compared to the more laborious and time-consuming classical methods of GC fractionation and bioassay. Natural chemicals that elicit EAD responses are identified by comparison to synthetic standards in the same way. The standards are usually chosen by comparison to previously identified compounds in closely related species. An unknown chemical may also be tentatively identified by MS or collected upon elution and compared to IR and NMR spectra of standards. The final confirmation of semiochemical attraction is done by a laboratory bioassay, or preferably, in the field using traps releasing the chemicals at rates comparable to natural sources.
ZETEX® insulating tape is rated to withstand continuous heat up to 593° C. The 15 mm thickness wrapped around a heating coil of 230° C offers protection from being burned. Ni-Cr 80/20 wire can be operated up to 1150° C with a melting point of 1400° C. This wire is also corrosion resistant and of high tensile strength (14,090 kg/cm2). A 12 V or 24 V ac transformer of appropriate amperage, as calculated by the equations or program, may also be used instead of a more expensive power rheostat. The cost of the insulating tape and Ni-Cr wire needed to build a heated transfer line was only about $20.
The heater coils can be used to heat chromatographic columns, transfer lines, and organic synthesis reaction vessels. Another use of heater coils is in the calibration of thermal data loggers and electronic thermometers (Byers and Poinar, 1982; Byers, 1984). An insulated coil can be heated at a constant voltage to a specific temperature and measured with a more accurate mercury thermometer or certified electronic thermometer by inserting the probe into the coil halfway. The other end of the coil can receive the thermometer to be calibrated so that simultaneous and adjacent readings can be done. This method is at least as stable as a controlled-temperature water bath, and can measure temperature well above the boiling point of water.
The heater wire coil equations will allow design and construction of various heating devices of particular dimensions and temperatures with minimal experimentation. The theory and practice of constructing heated transfer lines, as presented here, will facilitate building GC-EAD systems useful in neuroscience research.
Acknowledgements
I thank A. Dzhamay, University of Michigan, for help in presenting and explaining the calculus for determining the length of a helix.
References
Arn H, Städler E, Rauscher S. The electroantennographic detector - a selective and sensitive tool in the gas chromatographic analysis of insect pheromones. Zeitschrift für Naturforschung 1975; 30c:722-25.
Baker TC. Sex pheromone communication in the Lepidoptera: new research progress. Experientia 1989;45:248-62.
Baker TC, Francke W, Millar JG, Löfstedt C, Hansson B, Du JW, Phelan PL, Vetter RS, Youngman R, Todd JL. Identification and bioassay of sex pheromone components of carob moth Ectomyelois ceratoniae Zeller. Journal of Chemical Ecology 1991;17:1973-88.
Barata EN, Pickett JA, Wadhams LJ, Woodcock CM, Mustaparta H. Identification of host and nonhost semiochemicals of eucalyptus woodborer Phoracantha semipunctata by gas chromatography-electroantennography. Journal of Chemical Ecology 2000;26:1877-95.
Byers JA. Pheromone biosynthesis in the bark beetle, Ips paraconfusus, during feeding or exposure to vapours of host plant precursors. Insect Biochemistry 1981;11:563-69.
Byers JA. Electronic multiprobe thermometer and multiplexer for recording temperatures of microenvironments in the forest litter habitat of bark beetles (Coleoptera: Scolytidae). Environmental Entomology 1984;13:863-67.
Byers JA. Novel diffusion-dilution method for release of semiochemicals: Testing pheromone component ratios on western pine beetle. Journal of Chemical Ecology 1988;14:199-212.
Byers JA. Optimal fractionation and bioassay plans for isolation of synergistic chemicals: the subtractive-combination method. Journal of Chemical Ecology 1992;18:1603-21.
Byers JA. Internet programs for drawing moth pheromone analogs and searching literature database. Journal of Chemical Ecology 2002;28:807-17.
Byers JA, Poinar GO, Jr. Location of insect hosts by the nematode, Neoaplectana carpocapsae, in response to temperature. Behaviour 1982;79:1-10.
Byers JA, Birgersson G, Löfqvist J, Applegren M, Bergström G. Isolation of pheromone synergists of a bark beetle, Pityogenes chalcographus, from complex insect-plant odors by fractionation and subtractive-combination bioassay. Journal of Chemical Ecology 1990;16:861-76.
Dougherty MJ, Guerin PM, Ward RD, Hamilton JGC. Behavioural and electrophysiological responses of the phlebotomine sandfly Lutzomyia longipalpis (Diptera: Psychodidae) when exposed to canid host odour kairomones. Physiological Entomology 1999;24:251-62.
Hansson BS. Olfaction in Lepidoptera. Experientia 1995;51:1003-27.
Hansson BS, Szöcs G, Schmidt F, Francke W, Löfstedt C, Toth M. Electrophysiological and chemical analysis of sex pheromone communication system of the mottled umber, Erannis defoliaria (Lepidoptera: Geometridae). Journal of Chemical Ecology 1990;16:1887-97.
Hansson BS, Van Der Pers JNC, Högberg HE, Hedenström E, Anderbrant O, Löfqvist J. Sex pheromone perception in male pine sawflies, Neodiprion sertifer (Hymenoptera: Diprionidae). Journal of Comparative Physiology A. Sensory. Neural. and Behavioral Physiology 1991;168:533-38.
Hansson BS, Ljungberg H, Hallberg E, Löfstedt C. Functional specialization of olfactory glomeruli in a moth. Science 1992;256:1313-15.
Henning JA, Teuber LR. Combined gas chromatography-electroantennogram characterization of alfalfa flora volatiles recognized by honey bees (Hymenoptera: Apidae). Journal of Economic Entomology 1992;85:226-32.
Lanne BS, Schlyter F, Byers JA, Löfqvist J, Leufvén A, Bergström G, Van der Pers JNC, Unelius R, Baeckström P, Norin T. Differences in attraction to semiochemicals present in sympatric pine shoot beetles, Tomicus minor and T. piniperda. Journal of Chemical Ecology 1987;13:1045-67.
Löfstedt C, Van Der Pers JNC, Löfqvist J, Lanne BS, Appelgren, M, Bergström, G, Thelin B. Sex pheromone components of the turnip moth, Agrotis segetum: chemical identification, electrophysiological evaluation and behavioral activity. Journal of Chemical Ecology 1982;8:1305-21.
Roelofs WL. Chemistry of sex attraction. Proceedings of the National Academy of Sciences of the United States of America 1995;92:44-9.
Schlyter F, Zhang QH, Anderson P, Byers JA, Wadhams LJ, Löfqvist J, Birgersson G. Electrophysiological and behavioural responses of Scandinavian Tomicus piniperda and T. minor (Coleoptera: Scolytidae), to non-host leaf and bark volatiles. Canadian Entomologist 2000;132:965-81.
Silverstein RM, Rodin JO, Wood DL. Methodology for isolation and identification of insect pheromones with reference to studies on California five-spined Ips. Journal of Economic Entomology 1967;60:944-49.
Steullet P, Guerin PM. Identification of vertebrate volatiles stimulating olfactory receptors on tarsus I of the tick Amblyomma variegatum Fabricius (Ixodidae) II. Receptors outside the Haller's organ capsule. Journal of Comparative Physiology A Sensory, Neural, and Behavioral Physiology 1994;174:39-47.
Stewart J. Calculus. 1999. Brooks/Cole Publishing Company, Pacific Grove, California.
Van Der Pers JNC. Comparison of single cell responses of antennal sensilla trichodea in the nine European small ermine moths (Yponomeuta spp.). Entomologia Experimentalis et Applicata 1982;31:255-64.
Van Der Pers JNC, Löfstedt C. Continuous single sensillum recording as a detection method for moth pheromone components in the effluent of a gas chromatograph. Physiological Entomology 1983;8:203-11.
Zhang QH, Tolasch T, Schlyter F, Francke W. Enantiospecific antennal response of bark beetles to spiroacetal (E)-conophthorin. Journal of Chemical Ecology 2002;28:1839-52.
© 2004 by John A. Byers