Byers, J.A., Anderbrant, O., and Löfqvist, J. 1989. Effective attraction radius: A method for comparing species attractants and determining densities of flying insects. Journal of Chemical Ecology 15:749-765. pdf

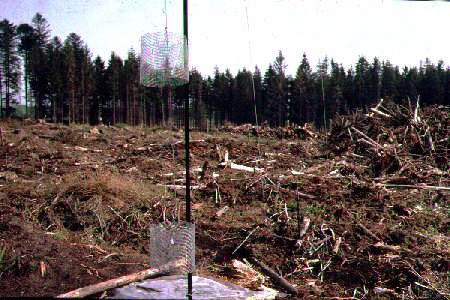
Sticky-traps on 12-m high pole (traps spaced every 1.2 m) baited with pheromone. Note second pole about 100 m away in the right-center of picture near tree line.

Abstract-The catches of bark beetles (Coleoptera: Scolytidae) were compared between attractive traps releasing semiochemicals and passive traps (cylindrical sticky screens hung, at 10 heights of 0.7-11.5 m, on poles). A central attractive-trap pole was surrounded by three passive-trap poles spaced 50 or 100 m away at the apices of an equilateral triangle. The catches of Tomicus piniperda and other scolytid species on the attractive-trap pole baited with host monoterpenes, or the catches of Ips typographus attracted to synthetic pheromone, were compared to passive trap catches in a Scots pine forest or in a Norway spruce clear-cut, respectively. Information about flight height distributions of the above scolytid species, and Hylurgops palliatus, Cryphalus abietis, Pityogenes chalcographus, P. quadridens, P. bidentatus, and Trypodendron domesticum were obtained on the passive and attractive trap poles. A new method is presented for determining the densities of flying insects based on the passive trap's dimensions and catch, duration of test, and speed of insect. Also, a novel concept, the effective attraction radius (EAR), is presented for comparing attractants of species, which is independent of insect density, locality, or duration of test. The EAR is obtained by the ratio of attractive and passive trap catches and the dimensions of the passive trap, and thus should correlate positively with the strength of the attractant and the distance of attraction. EARs are determined from catch data of T. piniperda and I. typographus as well as from the data of previous investigations on the same or other bark beetles.

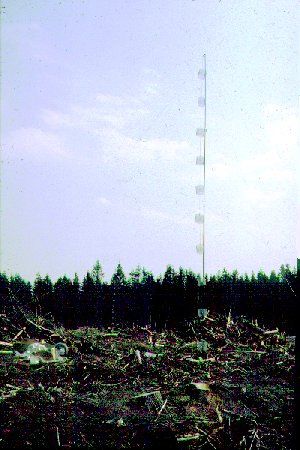
Sticy-traps on 12-m high pole (traps spaced every 1.2 m).
Key Words-Bark beetle, Ips typographus, Tomicus piniperda, Coleoptera, Scolytidae, pheromone, host attractants, dispersal, flight, Pityogenes, Hylurgops, Cryphalus, Trypodendron

INTRODUCTION

It is of ecological interest to determine the relative abundance of flying insects at various heights above ground. Also, such knowledge should be considered when using pheromone traps at certain heights for monitoring the abundance of a pest species. Information concerning the density of flying insects (per volume air or per area over land) is often required to build models of host and/or mate location, dispersal, and disease vector relationships. It is also of interest in chemical ecology to be able to compare the attractivities of various attractants of different strengths or blends within a species as well as between species at difFerent times or under different environmental conditions. For instance, one question might be whether host attractants are relatively as attractive to one species, which does not employ long-range pheromones [Tomicus piniperda (L.); Byers et al., 1985], as are pheromone components to another species [Ips typographus (L.); Schylter et al., 1987).

We present a method that provides information helpful for a better understanding of the above three topics: flight height, flight density, and comparison of attractant strengths both within and between species. The method involves comparing the catches of flying insects, exemplified by bark beetles, that are passively intercepted by cylindrical sticky screens suspended at various heights above ground on 12-m poles to the catches of these insects attracted to attractants released from sticky-screen traps on a similar pole in the same area.

METHODS AND MATERIALS

It is obvious that passive insect traps placed at various heights above ground will catch the proportion of insects flying at each of the respective heights. However, we believe such an arrangement of traps can also be used to determine with reasonable success the average densities of insects flying in the vicinity of the traps. Cylindrical sticky screens in the forest can be considered as "filtering" or intercepting bark beetles that fly or are carried through the area during their dispersal and host- and mate-seeking flight. If one had a cylindrical trap as long as a standing tree, or at least sample traps at many heights encompassing most of the levels of flight activity, then one can consider this system in a two-dimensional sense. The trap then can be visualized as a circle on a plane surface. The trap (or circle) then will catch an average number that is dependent on the trap's diameter (2 x radius), time length of trapping, average speed of flying beetles, and the density of flying beetles (number per area) as shown in equation 1:

Catch = 2 x radius x time x speed x density ( 1 )

However, if the passive sticky traps with a certain radius are placed in the forest for a specific time and catch, and we assume an average flight speed (either from observations of flying beetles or assuming a flight speed equal to the wind speed), then the density can be determined:

Density = catch/(2 x radius x time x speed) ( 2 )

Passive and attractive (attractant releasing) traps can also be used in a new concept and method, the effective attraction radius (EAR), for comparing semi-quantitatively the attraction distances of attractants both within and between species of insects. A maximum possible distance of attraction can be imagined with the earlier concept of the active space, in which a time-averaged volume (plume) containing above-behavioral-threshold semiochemical concentrations elicits attraction responses when entered by the insect (Bossert and Wilson, 1963; Nakamura and Kawasaki, 1977; Baker and Roelofs, 1981; Elkinton and Cardé, 1984). This concept can be modified to an attraction space to find distances from the source within which, for example, 50% of the entering insects are successful in finding the source. The average distance of attraction is another measurement which may be of interest. We now introduce a new concept, the EAR, which is equivalent to the distance from an attractive source within which all insects are assumed to be attracted. The EAR is the radius of a circular plane oriented perpendicular to the incoming insects and thus can be regarded as the radius of a spherical volume that surrounds the attractive source:

EAR = (ATC x LCSAPT x PTC-1 x 3.141593-1)1/2 ( 3 )

where ATC is the attractive trap catch, PTC is the passive trap catch, and LCSAPT is the longitudinal cross-sectional area of the passive trap. It is probable that "all" insects are never attracted to semiochemicals if within a specific distance of the source, and thus the EAR is not a "real" biological distance. However, the EAR does have positive relationships to the "real" maximum, 50% responding, and average distances of attraction as mentioned in the concepts above. While the active space model, the attraction space model, or the average attraction distance cannot be investigated easily with trap catches (Elkinton and Cardé,1984), the EAR can be found in a straightforward manner by simple comparison of two trap catches. For example, if a passive trap area in longitudinal cross section, A, containing no attractants, intercepts X number of beetles per time unit, and if, in the same vicinity, a similar trap containing attractant catches 20X beetles per time unit, then the eflective area (longitudinal cross section) of the attractive trap is 20 times larger than the passive trap, and the EAR = (20A/3.141593)0.5. This ratio of catch between the passive and attractive traps should remain similar regardless of the density of flying beetles, so consistent measurements of the EAR can be obtained on difterent dates or in different areas. The type and strength of attractant should be the most important factor in affecting the ratio.

To demonstrate our ideas concerning measurement of ftight density and EAR, we placed metal poles holding cylindrical sticky screens at 10 levels (from 0.7 to 11.5 m) in or near the forest. Three poles with passive traps were positioned at the apices of an equilateral triangle while a fourth pole with attractive traps (host attractants or pheromone) was placed in the center of the triangle. Each pole was 12 m high and constructed of four 28-mm diameter steel tubes (3 m long) interconnected and held upright by two sets of four guy wires attached at 6- and 12-m heights. At the top of each pole was a 30-cm arm with pulley which suspended a string of 10 cylindrical sticky screens so that they could be drawn up or down the pole between test periods. Each sticky screen was 30 cm tall by 15 cm radius (LCSAPT of 0.09 mz) of 6.5-mm square mesh coated with Stikem Special (Seabright Enterprises, Emeryville, California). The attraction of Tomicus piniperda (L.), the European pine shoot beetle, and associated bark beetles to host monoterpenes (Byers et al. ,1985) was investigated using the poles inside a Scots pine (Pinus sylvestris L.) forest, 60 years old, near Ängelholm, Sweden (April-May 1984). The passive poles were 50 m from the central attractive pole, forming a triangle of 87 m on a side. Each tubular trap had two open polyethylene vials (No. 730 Kartell, Italy), 30 mm x 6-mm ID, for each of the host monoterpenes, (+)-alpha-pinene (99% pure by GLC; [a]546 = +57.4o), (-)-alpha-pinene (>99.5% GLC; [a]546  50 ± lo), (+)-3-carene (>99% GLC; [a)D = 17 ± O.So), and terpinolene (>97.3% GLC). Chemicals were from Fluka AG, West Germany, and Carl Roth, Sweden. Each trap released about 10-20 mg/day of each of the monoterpenes except for about 3-5 mg/day of terpinolene (these rates are equivalent to that released from a freshly cut Scots pine log, 28 cm x 15 cm diam.; Byers et al., 1985). Flight characteristics of Ips typographus (L.), the European spruce bark beetle, were similarly studied within a year-old clear-cut area adjacent to Norway spruce [Picea abies (L.) Karst.) forest in Esrum forest district, near Hillerød, Denmark (May 1984). The passive poles were positioned 100 m from the central attractive pole in the corners of a triangle 173 m on a side. These distances between passive and attractive trapping poles were chosen because trap and semiochemical interactions are minimal (Schlyter et al., 1987; Byers, 1987) while population levels of flying beetles are still expected to be rather uniform within this area. Each cylindrical trap on the attractive pole had two pheromone dispensers, which released 5 mg/day of 2-methyl-3-buten-2-ol and 0.1 mg/day of (4S)-cis-verbenol (Schlyter et al., 1987). Trapping in both areas was done in the afternoon for the time periods and dates as shown in Table 1. Wind speeds were taken with a fan anemometer. Bark beetles of all species caught on the sticky traps during each period were removed at the end of the test time, cleaned in petroleum ether, and sex determined for T. piniperda and I. typographus.

Since it is possible that too small an active trap would catch a disproportionately small number attracted to the source and thus adversely affect measurement of the EAR, we tested four trap sizes each with the same pheromone bait as above on I. typographus. Cylindrical sticky screens were similar to those above and of the same length (30 cm) but varied in radius, at 3.75, 7.5, 15, and 30 cm. These traps were each held at 1.5 m height by wires from a 22- mm-diam. steel tube driven into the ground. Two sets of each of the four sizes were tested in May and June of 1984 and 1985 for a total of 21 replicates with rotation among positions. Linear and logarithmic regressions of the total catches and of the proportions among trap sizes at each trap radius were compared.

RESULTS

Height above Ground of Flying Bark Beetles. Catches of bark beetles by the passive sticky screens indicate that most species fly above 0.7 m (the lowest trap level), are most abundant at 1.9-5.5 m, and gradually fly less frequently at still higher levels (Figures 1 and 2). This pattern is shown best by Hylurgops palliatus Gyll., Pityogenes bidentatus Hbst., P. quadridens Hart., Trypodendron domesticum L. (although catch was low), and l. typographus. P. chalcographus L. and T. piniperda also did not fly near the ground but they seemed to exhibit a more uniform distribution of flight heights (Figures 1 and 2), although the numbers for T. piniperda are too low for reliable estimates.

Fig. 1. Height of flying bark beetles as percent of total catch on passive sticky-screen traps or "attractive" sticky-screen traps releasing host monoterpenes at each level [(+)-alpha-pinene, (-)-alpha-pinene, (+)-3-carene each at 10-20 mglday and 3-5 mg/day of terpinolene]. Passive traps at each height on three 12-m poles were spaced 50 m away from a central active trap pole in Scots pine forest (May l, 1984).

Most of the distributions of beetles at the heights seemed unaffected by semiochemicals since chi-square comparisons of the passive and attactive distributions yielded no significant differences for each species (P > 0.1) except for P. quadridens (P < 0.05), T. piniperda (P < 0.05), and I. typographus (P < 0.001). However, the distributions of P. quadridens on the attractive traps is based on a low number, and it is difficult to explain the pattern. The pattern of T. piniperda is also based on low numbers, but it is consistent with the pattern for I. typographus in which attractive pheromone traps catch proportionately more beetles on the lowest traps (Figure 2).

Fig. 2. Height of flying bark beetles as percent of total catch on passive sticky-screen traps or attractive sticky-screen traps releasing host monoterpene attractants (T. piniperda) or pheromone components (l. typographus). Placement of trap poles was as in Figure 1 for T. piuiperda (April 15 and 21, 1984). For I. typographus the passive poles were spaced 100 m away from the attractive pole in a clear-cut of Norway spruce forest (May 17, 19, 20-22, 1984). Monoterpene attractant release as in Figure 1, while the pheromone components, 2-methyl-3-butene-2-ol and cis-verbenol, were released at 5 and 0.1 mglday, respectively, at each trap level.


Density of Flying Bark Beetles. The number of bark beetles caught on passive and attractive sticky-screen traps, trapping periods, and speeds of beetles (either observed or assumed to be equal to the meastxred wind speed) were used to calculate the densities of flying beetles per hectare in the level from 0 to 12 m using equation 2 and multiplying by 4 to account for the gaps between traps (Table 1).
TABLE 1. Number of bark beetles caught on passive and active sticky-screen traps, trapping periods, and wind speeds used to calculate EARs of baits and densities of flying beetlesa
Beetles caughtFlying beetles/hextare estimated from passive trap poles
Date
1984
Passive
traps
Active
traps
Wind
(m/sec)
Trapping
duration
(min)
EARb
( m )
ABCAverage
Tomicus piniperdac
April 15727< 0.52400.581761713
April 21319< 0.52400.7461206
Ips typographusd
May 17171942.231500.999313738
May 194184.001600.6214005
May 20502692.702500.6812830755
May 2115443.762350.41( > 58)e308(> 32)
May 22172151.561350.85(148)f3290
aDensities were calculated from equation 2 using trapping durations as shown and beetles were assumed to fly at the respective wind speeds (catch = actual catch x 4 to correct for incomplete trapping surfaces).
bBased on average catch of passive trap poles.
cDensities of flying beetles based on observed flight speed of 1.6 m/sec; attraction of beetles to host monoterpene mixture.
dDensities of flying beetles based on wind speeds; attraction of beetles to pheromone components. ePole blown down during experiment.
fBeetle density actually measured at center location, while pheromone bait was at position B.
The densities of flying beetles (per hectare) were estimated for each trap pole on each day for T. piniperda and I. typographus (Table 1) and for six other species of bark beetle (Table 2) to indicate the variation in density with respect to time, area of forest, and species.
TABLE 2. Densities of flying bark beetles in Scots pine forest near Angelholm, Sweden, during afternoons (1330-1730 hr) of spring days as estimated from passive sticky screens on 12-m polesa
Flying beetles per hectare estimated from trap poles
SpeciesABCAverage
April 15, 1984
Hylurgops palliatus5217981104
Trypodendron domesticum6291717
April 21, 1984
Hylurgops palliatus6299844
Trypodendron domesticum66128
May 1, 1984
Hylurgops palliatus12231717
Trypodendron domesticum61268
Pityogenes chalcographus17487226162
Pityogenes quadridens116819397
Pityogenes bidentatus5275644
Cryphalus abietis307729365467
aDensities were calculated from equation 2, where trapping was for 4 hr; all species were assumed to fly at 1.6 m/sec as observed for T. piniperda; and catch = actual catch x 4 to correct for incomplete trapping surfaces.
Effective Attraction Radius for Comparing Attractants of Insects. The average of EARs for the traps on the entire trap pole in both T. piniperda and I. typographus were similar as were the EAR estimates for each day (Table 1). The lowest EARs for I. typographus were correlated with the highest wind speeds (Table 1). The EAR was largest at the bottom trap level for both species, and it was larger for the pheromone compared to host monotetpenes at the dosages used (Figure 3).

FIG. 3. Compatisons of the effective attraction radü (EAR) of attractive, monoterpene-releasing, sticky-screen traps (T. piniperda) or of pheromone-releasing, sticky-screen traps (I. typographus). Release of semiochemicals as in Figures 1 and 2.

At other levels, the EARs were similar within a species as well as between the two species. The sticky-screen traps of increasing radius (3.75-30 cm) caught increasing numbers of beetles in a logatithmic relationship (Figure 4).

Fig. 4. Logarithmic relationship between number of I. typographus caught on phero- mone baits and increasing radius of the sticky-screen trap at 1.5-m height. Traps released 5 mg/day of 2-methyl-3-butene-2-ol and 0.1 mg/day of cis-verbenol. The encircled point shows the size of trap used in the attractive and passive pole experiments.

This curve may be expected if beetles have increasing difficulty finding a point source of pheromone (i.e., must turn more rapidly than possible near the source). The coefFlcient of determination (0.97) was larger than that for a linear relationship (r2 = 0.90).

DISCUSSION

Height above Ground of Flying Bark Beetles. Several studies have inves- tigated the height at which a particular species of bark beetle flies. However, most of these studies have used only: (1) traps with pheromone, (2) traps atjust a few levels, (3) traps at widely spaced levels (up to 150 m height), or (4) traps that collected beetles for several months. Our 10 passive traps from 0.7 to 1 I .5 m high appeared sufFtcient to determine with some precision the distribution of flight heights over the normal flight range for H. palliatus, Cryphalus abietis Ratz. , T. domesticum, P. bidentatus, P. quadridens, and I. typographus but not, apparently, for P. chalcographus and T. piniperda (Figures 1 and 2). The catch for T. piniperda was too low to reliably estimate the distribution. On the other hand, P. chalcographus exhibited a uniform distribution, except at the bottom level, which probably indicates they were flying also at higher levels than the range of traps, as if they were dispersing through the pine forest (a nonhost tree).

In one of the first studies of flight-height distribution in bark beetles, Gara and Vité (1962) used rotary net traps to suggest that no difFerences in flight activity of Dendroctonus brevicomis LeConte and other bark beetles occurred from ground level to lower crown regions, but "in the upper crown and above forest stands, bark beetles seemed to fly less frequently." Shore and McLean ( 1984) found Trypodendron lineatum Ol. responded over 76 days to lineatin-baited traps at 0-, 1-, 2-, 3-, and 4-m heights with most (31.6%) caught on the 1-m trap at the level just above the underbrush (effectively the lowest trap). The highest catch on the "lowest" trap of a column of traps releasing semiochemicals is the same result we found for T. piniperda and I. typographus (Figure 2). It is possible that these high catches on the lowest trap were due either (I) to beetles flying lower in order to avoid flying against higher wind speeds, (2) to increasing inability to orient to the source at higher levels due to relatively stronger, more turbulent wind or a decrease in the optomotor response further from the ground, or (3) to the absence of a visual silhouette (tree) in conjunction with odor stimuli, and thus they were trying to land on a fallen tree.

Schmitz ( 1980) intercepted I. pini Say as they flew to a source of naturally produced pheromone (0- to 2-m height) by four columns, one in each cardinal direction, of 11 flat sticky traps from 2 to 17 m high about 45 m from the source. He found most beetles flew below 10 m as they approached the source. However, these results cannot be compared either to our passive trap catches or to our column of semiochemical release.

Cuthbert and Peacock (1975) placed flat sticky traps baited either with multilure or not at about 3.5-, 7-, and 12-m heights in healthy or diseased elm trees. They found that Scolytus multistriatus Marsh. was caught predominantly at the 3.5-m height in baited or unbaited traps, a result similar to our studies. Forsse and Solbreck (1985) placed suction traps at 2, 9, 43, and 93 m on a TV tower and caught I. typographus only at 2 and 9 m. They report that the density-height profile of all bark beetle species caught (Solbreck, 1985) indicates that less than 14% of any species flies above 20 m. Using a similar regression technique (exponential without 0.7-m height for all r2 > 0.78), we predict that 87 % of I. typographus fly between 1 and 11.5 m high of all those flying up to 100 m high. Similarly, 84% of H. palliatus, 89% of C. abietis, and 89% of P. quadridens fly below 11.5-m height.

Duelli et al. (1986) placed pheromone traps near passive traps at nine heights from 1.7 to 150 m on a weather tower and found that less than 5 % of I. typographus fly above 10 m. In contrast, P. chalcographus had a more gradual decrease in proportion, flying at higher levels (14% flew higher than 10 m), which is similar to our results for this species (Figure 1). However, their results on the passive catches are uncertain because complete or partial pheromone blends were placed at the same heights on the tower as were the passive traps.

Density of Flying Bark Beetles. The density of flying insects can be determined either by active methods, whereby suction fans or rotary nets capture insects, or by passive methods such as our sticky traps. Our investigation is the first to use such passive methods to determine densities of flying beetles, but the results of previous studies can be reanalyzed according to equation 2 for comparison. However, studies that report catches of bark beetles in barrier traps are less accurate for this purpose because beetles may avoid them due to air turbulences or may recover their balance after striking the barrier (Chapman and Kinghorn, 1958). Also, a conversion from the width of flat traps to a diameter (2 x radius) for tubular traps must be done according to the average trap interception area:


Thus, assuming a 5-hr ftight for each day of a 37-day test and 2 m/sec speed of beetle or wind, then Cuthbert and Peacock (1975) had a density of flying S. multistriatus in the healthy elms (0-12 m height) of 1/hectare and in the diseased elms of 2069/hectare. The results of Schmitz ( 1980) for I. pini can be similarly adjusted to yield an average density of 43/hectare (0- to 17-m height) at 45 m away from a source of pheromone. Byers et al. (1985) report a catch of 52 T. piniperda on two blank sticky traps (25 cm diam.) for 15 hr (time unpublished) during the maximum swarming, which yields about 401 flying beetles per hectare (0-10 m), clearly a higher population level than that in Table 1.

Our method of flight density estimation assumes that beetles do not avoid, or are attracted to, the passive traps and thus cause us to under- or overestimate the population level. Nijholt (1983) questioned whether sticky-screen traps appear transparent to bark beetles because he found a nonrandom distribution of catch on a 60 x 80-cm-wide screen held 60 cm above ground. The average catch of the peripheral areas of the trap was less than the center. However, it is possible that through the beetles' movements to free themselves from the stickem, they gradually slid down the sticky screens so that the top periphery of the trap was depleted of beetles over time, thus accounting for the difference. Furthermore, the bottom area may have caught less beetles simply because fewer beetles fly near the ground.

Bark beetles are known to respond to visual silhouettes of the size of a tree trunk often in combination with attractive semiochemicals (Tilden et al., 1983; Borden et al., 1986; Payne,1986). The resolving power of insect eyes depends on the number of facets and the ommatidial angle. Insects with higher visual acuities have higher numbers of ommatidia; the eye of the lamellicorn beetle Polyphylla fullo has 12,150 facets, the housefly about 4000, and dragonflies about 10,000-28,000 (Wigglesworth, 1972). Bark beetles are known to have rather low acuity, which is explained by the low number of ommatidia. Using scanning electron micrographs of several genera of Scolytidae, we found that the eyes of all species have similar low numbers of ommatidia. For example, I. typographus has 215 facets per eye, T. piniperda also has 215, Scolytus laevis Chap. has 235, and P. chalcogaphus only 110. In comparison, the bark beetle predator, Thanasimus formicarius (L.) (Cleridae), has 610 facets per eye, and the cerambycid, Acanthocinus aedilis (L.), has about 650.

Our sticky-screen traps were at least 75 % transparent while Stikem Special is translucent, thus, the traps are similar to spider webs, which are effective in catching insects with moderate to poor visual acuity. Therefore, it is probable that the bark beetle species collected neither were attracted to nor avoided the visual outlines of the sticky traps.

As mentioned above, capture methods have usually been used to estimate flight densities. Chapman and Kinghorn (1958) used 6 m/sec rotary nets 2 m above log piles during spring swarming of T. lineatum to find maximum densities of 1.521/m3. This value can be converted to densities for a 0- to 12-m layer (182,520/hectare) or for a 0- to 3-m layer (45,630/hectare). Forsse and Solbreck (1985) used suction traps that generated an airflow of 1.67 m3/sec to capture bark beetles at four heights. However, estimation of densities from this method is doubtful as insects are only captured when very near the suction inlet. This distance of capture is hard to estimate because it is different for every insect, depending on their size and speed (Leos-Martinez et al., 1986).

The results of our passive sticky-screen catches indicate that at the densities we measured, few trees in the forest would escape being closely passed by or landed upon by the common bark beetle species. This is in accordance with findings for D. ponderosae Hopkins (Burnell,1977; Raffa and Berryman,1980; Hynum and Berryman, 1980), showing that beetles land on most trees in the forest and that this pattern can result from randomly flying beetles. Primary attraction indicating more susceptible hosts to T. piniperda (Byers et al.,1985) would thus not need to reach very far (on the order of our EARs) to attract the pioneer beetles. If the host conditions were suitable, these pioneers could generate aggregation pheromone (although this does not appear to be the case for T. piniperda) or increase the release of the primary attractants through boring activities (secondary attraction).

Effective Attraction Radius for Comparing Attractants of Insects. Vité and Gara (1962) hypothesized that the number of bark beetle attacks in a source of attractant influenced the distance over which beetles were drawn, but few experiments have tested this or determined the distance-concentration relationship. Using rotary-net traps at the pheromone source and at 15 and 30 m away, Vité and Gara (1962) showed that I. paraconfusus Lanier were attracted from at least 15 m away to the infested logs. Possibly even at 30 m there was an increased capture rate, but control data were not presented to establish a difference. Byers (1983) used a grid of passive sticky traps in three rows distant from a pheromone source of I. paraconfusus to show that "wild" beetles of both sexes were attracted from at least as far away as 18 m. While an average or a maximum attraction distance must exist for each specific attractant/species combination, they are diffilcult to determine, as noted above. On the other hand, the EAR is easy to establish and yields an index of the attraction distance so that comparisons can be made between different times, areas, semiochemical releases, and insect species.

EARs were calculated at 10 heights for T. piniperda attraction to monotetpenes released equivalent to a "small log" (28 cm x 13 cm diam.; Byers et al., 1985) and for I. typographus attraction to "medium" levels (Schlyter et al., 1987) of pheromone (Figure 3). However, these estimates at different heights may have been greatly influenced by semiochemical interactions between traps. It would be interesting to test only one pair of traps alone at each of the levels to see how this affects the EARs. The EAR estimates for T. piniperda appear similar to those that can be obtained from the data of Byers et al. (1985) for a small log (EAR = 0.59 m) or a 30 male + 30 female infested log (EAR = 0.65 m) or small log-equivalent in monoterpene release (EAR = 0.91 m) and check log (EAR = 1.02 m) at 1.5 m height.

Our EAR estimates for I. typographus were probably affected by the higher than usual wind speeds in the clear-cut (Figure 3, Table 1). Schlyter et al. (1987) compared a "high" dose (10 x "medium") of I. typographus pheromone to a blank, 12 m away at 1.5-m height, and so we can calculate an EAR of 1.90 m, and for their "medium" dose an EAR of 0.57 m. If the blank had been placed further away, so as not to intercept any pheromone-responding beetles, then the EAR estimate would have been higher and more appropriate. Thus, as expected, higher release rates of pheromone have higher EARs. Similar procedures can be used to calculate EARs on previous work that used sticky traps. For example, Byrne et al. (1974) used sticky traps to catch 6724 Gnathotrichus sulcatus on two sulcatol-baited traps (each releasing 48-240 µg/day) versus 51 on two control traps (0.0954 m2 interception area), which yields an EAR of 2.00 m.

An EAR can be calculated for any semiochemical and responding insect species if the passive trap effectively "filters" the fiying population according to the trap's size (sticky traps). However, the attractive trap, while not needing to be of the same type or dimension as the passive trap, does need to (1) effectively catch a significant proportion of the insects responding and (2) be similar or smaller in size than the passive trap in order to obtain consistent EARs for a particular chemical-insect combination. The trapping efficiencies (percentage of beetles contacting the trap that are caught) of the passive and attractive traps within a test pair would not affect the EAR, as long as the efficiencies were similar. The efficiencies could even be different on different occasions and not change the EAR unless the efficiencies change disproportionately between the passive and attractive traps.

Trap size does effect trapping efficiency since Tilden et al. ( 1979) showed that many more D. brevicomis were attracted to the vicinity of a pheromone source and small surrounding trap than were caught on this trap. EAR estimates obtained by increasing the passive and attractive trap radius would tend to increase as a function of the trapping efficiency (size) of the attractive trap (Figure 4). Thus, the question arises: how does one determine the optimal size of attractive trap to obtain consistent and maximum EAR estimates?

Ideally, one should compare several attractive traps of increasing radü to determine the function of trapping effilciency with trap size and the effect on the EAR. In this way, the appropriate trap size can be determined that yields a consistent and nearly maximum EAR, with a minimum of trap size for practical reasons. In I. typographus (Figure 4), we found that little further benefit in maximizing the EAR estimate is gained with increasingly larger attractive traps beyond 15- to 30-cm radius (we used the 15-cm radius on the poles), while there are increasing costs of further enlargements of trap radius. It can also be seen in Figure 4 that I. typographus seem to find it increasingly more difficult to locate pheromone sources that are much smaller than the diameter of a tree. We predict that such curves for moth species will be shifted to the left on the x axis, indicative of the smaller target of a female moth.

Several environmental factors will influence the active space (Elkinton and Cardé, 1984), as well as the EAR, such as temperature, wind speed, and their variation over time. However, these parameters are rather consistent when bark beetles are responding to semiochemicals. For valid EAR measurements, the height of the passive and attractive traps should be the same but the level is, in theory, not too important as different heights would appear as tests at diflerent densities of flying beetles, which has little effect on the EAR. However, our measured EARs at diflerent heights indicate that height may be important either due to windy conditions, response variation with height, or trap interactions.

Thus, it appears that EAR estimates for a particular species should be qualified by specifying the height of the attractive and passive traps, the release rate of the semiochemical, and the sizes of the traps. Since most pheromone catches of scolytids have been done at the 1.5-m height, and we obtained the largest EAR at about this level, we think this level is appropriate for interspecific comparisons.

Acknowledgments-This work was supported in part by grants from Sweden, STU (84-3937) and others, NFR, FRN, and SJFR; and from the USA, NSF (INT-8503520). We are grateful to E. Jirle, J. Jönsson, E. Marling, and B. Hansson for help in setting up the poles in the field. E. Jirle and J. Bömfors provided assistance in the sex and species determination of the bark beetles collected. F. Schlyter provided appropriate baits for I. typographus. J. Jönsson gave helpful assist- ance in the construction of the 12-m poles. We thank foresters in Esrum forest district for their cooperation and appreciate the use of Strødam Biological Station in Demmark. We thank F. Schlyter and T.C. Baker for review of the manuscript.

J. A. BYERS1,2, O. ANDERBRANT1, J. LÖFQVIST1,2

1Department of Animal Ecology, Lund University, SE-223 62 Lund, Sweden
2 Present address:

REFERENCES

BAKER, T.C., and ROELOFS, W.L. 1981. Initiation and termination of oriental fruit moth male response to pheromone concentration in the field. Environ. Entomol. 10:211-218.

BORDEN, J.H., HUNT, D.W.A., MILLER, D.R., and SLESSOR, K.N. 1986. Orientation in forest Coleoptera: An uncertain outcome of responses by individual beetles to variable stimuli, pp. 97-109, in T.L. Payne, M.C. Birch, and C.E.J. Kennedy (eds.). Mechanisms in Insect Olfaction. Clarendon Press, Oxford.

BOSSERT, W.H., and WILSON, E.O. 1963. The analysis of olfactory communication among animals. J. Theor. Biol. 5:443-469.

BURNELL, D.G. 1973. A dispersal-aggregation model for mountain pine beetle in lodgepole pine stands. Res. Popul. Ecol. 19:99-106.

BYERS, J.A. 1983. Sex-specific responses to aggregation pheromone: Regulation of colonization density in the bark beetle Ips paraconfusus. J. Chem. Ecol. 9:129-142.

BYERS, J.A. I987. Interactions of pheromone component odor plumes of western pine beetle. J. Chem. Ecol. l3:2143-2157.

BYERS, J.A., LANNE, B.S., LÖFQVIST, L., SCHLYTER, F., and BERGSTRÖM, G. I985. OIfactory recognition of host-tree susceptibility by pine shoot beetles. Natunvissenschaften 72:324-326.

BYRNE, K.J., SWIGAR, A.A., SILVERSTEIN, R.M., BORDEN, J.H., and STOKKINK, E. 1974. Sulcatol: Population aggregation pheromone in the scolytid beetle, Gnathotrichus sulcatus. J. Insect Physiol. 20:1895-1900.

CHAPMAN, J.A., and KINGHORN, J.M. 1958. Studies of flight and attack activity of the ambrosia beetle, Trypodendron lineatum (Oliv.), and other scolytids. Can. Entomol. 90:362-372.

CUTHBERT, R.A., and PEACOCK, J.W. 1975. Attraction of Scolytus multistriatus to pheromone-baited traps at different heights. Environ. Entomol. 4:889-890.

DUELLl, VON P., STRUDER, M., and NÄF, W. 1986. Der Borkenkäferflug auserhalb des Waldes. J. Appl. Entomol. 102:139-148.

ELKINTON, J.S., and CARDÉ, R.T. 1984. Odor dispersion, pp. 73-91, in W.J. Bell and R.T. Cardé (eds.). Chemical Ecology of Insects. Chapman and Hall, London.

FORSSE, E., and SOLBRECK, CH. 1985. Migration in the bark beetle Ips typographus L.: Duration, timing and height of flight. Z. Angew. Entomol. 100:47-57.

GARA, R.I., and VITÉ, J.P. 1962. Studies on the flight pattems of bark beetles (Coleoptera: Scolytidae) in second growth ponderosa pine forests. Contrib. Boyce Thornp.son Inst. 21:275-289.

HYNUM, B.G., and BERRYMAN, A.A. 1980. Dendroctonus ponderosae (Coleoptera: Scolytidae): Pre-aggregation landing and gallery initiation on lodgepole pine. Can. Entomol. 112:185-191.

LEOS-MARTINEZ, GRANOVSKY, T.A., WILLiAMS, H.J., VINSON, S.B., and BURKHOLDER, W.E. 1986. Estimation of aerial density of the lesser grain borer (Coleoptera: Bostrichidae) in a warehouse using dominicalure traps. J. Econ. Entomol. 79:1134-1138.

NAKAMURA, K., and KAWASAKl, K. 1977. The active space of the Spodoptera litura (F.) sex pheromone. Appl. Entomol. Zool. 12:162-177.

NIJHOLT, W.W. 1983. Flight behavior of ambrosia beetles near free-standing sticky-screen traps. Can. For. Serv. Res. Notes 3:8-9.

PAYNE, T.L. 1986. Olfaction and vision in host finding by a bark beetle, pp. 111-116, in T.L. Payne, M.C. Birch, and C.E.J. Kennedy (eds.). Mechanisms in Insect Olfaction. Clarendon Press, Oxford.

RAFFA, K.F., and BERRYMAN, A.A. 1980. Flight responses and host selection by bark beetles, pp. 213-233, in A.A. Berryman and L. Safranyik (eds.). Dispersal of Forest Insects: Evaluation, Theory and Management Implications. Proceedings IUFRO Conference, Cooperative Extension Service, Washington State University, Pullman, Washington.

SCHLYTER, F., BYERS, J.A., and LÖFQVIST, J. 1987. Attraction to pheromone sources of different quantity, quality, and spacing: Density-regulation mechanisms in bark beetle Ips typographus. J. Chem. Ecol. 13:1503-1523.

SCHMlTZ, R.F. 1980. Dispersal of pine engraver beetles in second growth ponderosa pine forests, pp. 41-50, in A.A. Berryman and L. Safranyik (eds.). Dispersal of Forest Insects: Evaluation, Theory and Management Implications. Proceedings IUFRO Conference, Cooperative Extension Service, Washington State University, Pullman, Washington.

SHORE, T.L., and McLEAN, J.A. 1984. The effect of height of pheromone-baited traps on catches of the ambrosia beetle, Trypodendron lineatum. J. Entomol. Soc. B.C. 81:17-18.

SOLBRECK, C. 1985. Insect migration strategies and population dynamics. Contrib. Mur. Sri. Suppl. 27:641-622.

TILDEN, P.E., BEDARD, W.D., WOOD, D.L., LINDAHL, K.Q., and RAUCH, P.A. I979. Trapping the western pine beetle at and near a source of synthetic attractive pheromone: Effects of trap size and position. J. Chem. Ecol. 5:519-531.

TILDEN, P.E., BEDARD, W.D., LINDAHL, K.Q., JR., and Woou, D.L. 1983. Trapping Dendroctonus brevicomis: Changes in attractant release rate, dispersion of attractant, and silhouette. J. Chem. Ecol. 9:311-321.

VITÉ, J.P., and GARA, R.I. 1962. Volatile attractants from ponderosa pine attacked by bark beetles (Coleoptera: Scolytidae). Contrib. Boyce Thompson Inst. 21:251-273.

WIGGLESWORTH, V.B. 1972. The Principles of Insect Physiology, pp. 235-237. John Wiley & Sons, New York.

home page