Byers, J.A. 2000. Wind-aided dispersal of simulated bark beetles
flying through forests. Ecological Modelling 125:231-243.  pdf
pdf
JOHN A. BYERS
Department of Crop Science
Swedish University of Agricultural Sciences
SE 230-53 Alnarp, Sweden
|
Present address:

|
|---|
 Abstract
see it in
Larger bark beetles such as Ips typographus (Coleoptera: Scolytidae) fly at
about 2 m/s for up to several hours. Computer simulations in two dimensions showed that
bark beetles are capable of dispersing from a brood tree over wide areas while drifting with
the wind. For example, if beetles take an angle of maximum turn (AMT) at random up to
10° either left or right each second, about 90% of the beetles become distributed over
a 31.9 km2 area after 1 hour of flight. Larger maximum turning angles by beetles
decrease the area of dispersal in proportion to the reciprocal of the square of the AMT. An
increase in the dispersal time causes a linear increase in dispersal area and downwind drift
distance, while increases in wind speed have no affect on the ultimate dispersal area but do
increase the drift distance. Dispersal of bark beetles in a 10 x 10 km forest of 5 million trees
of 0.15 m trunk radius, corresponding to the natural density and trunk size of a 70-year-old
Norway spruce forest (Picea abies), was simulated by spacing trees at appropriate
density in a 50 m radial area centered on a beetle. A new area with trees was constructed
similarly whenever the beetle left the former area. These simulations showed trees reduced
the size of the dispersal area by 11% and downwind drift by 18% after 1 hour of flight due to
the effect of turning some beetles back toward the release point, similar to the effects of
increasing the AMT. The average dispersal distance and downwind distance decreased as
linear functions of trunk density. Given step size, number of steps, and AMT, the correlated
random walk equation of Kareiva and Shigesada (1983) predicts mean squared dispersal
distance. This can be transformed to the more meaningful average dispersal distance by
taking the square root and multiplying by a proportion obtained from a three dimensional
surface equation fitted from simulation results.
Keywords: Dispersal; Migration; Host selection; Populations; Correlated Random
Walk
1. Introduction
Bark beetles (Coleoptera: Scolytidae) are important predators of coniferous forests. For
example, Norway spruce (Picea abies), predominating in many regions of Europe and
Asia, is attacked by Ips typographus, the tree's most serious enemy (Austarå et
al. 1984). The adults of `aggressive' bark beetle species in the genera Ips and
Dendroctonus must kill the host tree so that it does not continue to produce toxic resin
that can also entrap the beetles and their larvae (Byers, 1995). Thus, newly emerged adults
emerge from the brood tree or overwintering sites and fly in search of the usually rare hosts
that are more susceptible due to disease and abiotic factors such as drought and storm
damage. A few beetles of the population are termed `pioneers' since they presumably are first
to locate and `attack' a susceptible tree and begin the colonization. If the tree is of low
resistance, then insufficient resin is produced to repel the pioneer beetle so it has time to feed
and produce pheromone. This causes a large part of the flying population in the vicinity to
aggregate in response to the pheromone and exploit the food and mate resource (Byers,
1996a). The host-selection process by pioneers and the population dispersal flight are still not
well understood.
Insects disperse when their habitat is becoming unsuitable. This can be from a lack
of food resources, mating possibilities, territories and suitable domiciles or from the need to
escape the local buildup of parasites and predators (c.f. Ricklefs, 1990). Apparently for the
same reasons, bark beetles emerge from the dead brood tree, or litter near the brood tree,
and begin a dispersal flight that probably can range from a few meters to several kilometers.
Evidence from the laboratory has shown that bark beetles can fly remarkably far. For example,
Jactel and Gaillard (1991) flew Ips sexdentatus on rotary flight mills connected to
computer and found that 50% of the beetles could fly more than 20 km based on about 50
interrupted flights (a total of at least 2.5 hours of flight). In another study where I.
typographus were placed on flight mills, the longest continuous fight was 6 h and 20 min
(Forsse and Solbreck, 1985). This indicates that a few I. typographus flying at 2 m/s
(Byers et al., 1989) could travel up to 45.6 km without the aid of wind. Strong individuals of
the Douglas-fir beetle, Dendroctonus pseudotsugae, flew up to 8 h uninterrupted on
flight mills (Atkins, 1961), and the southern pine beetle, D. frontalis, has flown up to 6
h on a flight mill (G. Birgersson, personal communication).
Knowledge of how far and where bark beetle populations disperse is mainly from (1)
mark-release-recapture studies using pheromone traps and from (2) the geographical
occurrence of new infestations relative to previous ones. Both lines of investigation are
inconclusive since (1) only a few pheromone traps were used, usually some tens to hundreds
of meters from the release site, so that a large proportion of released beetles escaped, or (2)
the origins of attacking beetles were uncertain. Several studies have placed various sized
rings of pheromone traps around a source of marked beetles. For example, the spruce bark
beetle of Europe, I. typographus, was recaptured at various outer distances from 120
to 1000 m (Botterweg, 1982; Zumr, 1992; Zolubas and Byers, 1995; Duelli et al., 1997). In
California, I. paraconfusus was recaptured in outer traps at 2 km (Gara, 1963). The
ambrosia beetle, Trypodendron lineatum, was recaptured at 500 m (Salom and
McLean, 1989). As expected, a small proportion of the released beetles were recaptured by
the widely-spaced outer traps, and the large gaps between traps probably allowed many to
slip through as they drifted with the wind (e.g., gaps of 785, 1257, and 393 m in Zumr, 1992;
Gara, 1963; and Salom and McLean, 1989; respectively). An adverse effect of marking,
although discounted, might also influence the dispersal.
Anecdotal evidence of long-range dispersal (Nilssen, 1978; Miller and Keen, 1960) is
inconclusive since it is difficult to rule out all possible sources of beetles. The best evidence
of this type is found in Miller and Keen (1960) who summarize results of studies by the US
Forest Service in California on the western pine beetle, Dendroctonus brevicomis. This
beetle infested `islands' of ponderosa pine, initially free of beetles, that were separated from
the main forest by open sagebrush areas. They concluded that significant numbers of bark
beetles must have flown a minimum of 3.2 km in one study, and 9.6 or even 20 km in another
study, to reach the infested trees and kill them.
Little is known about the flight paths of bark beetles since they are small and dark, thus
difficult to observe for any significant distance. Ips typographus and some other
Ips and Dendroctonus species have been caught primarily under 10 m in height
or under the forest canopy (Gara and Vité, 1962; Forsse and Solbreck, 1985; Duelli et al.,
1986; Byers et al., 1989). I once ran after several individual I. typographus that had
taken flight from a brood log pile in a clearcut in a 3-4 m/s wind in which they flew or drifted
generally downwind (none flew crosswind) at 2-3 m height in an approximately straight path
for some 60 meters. Bark beetles, including I. typographus, usually fly away from
release sources in all directions unless winds are strong where they appear to drift with the
wind (Meyer and Norris, 1973; Botterweg, 1982; Helland et al., 1984; Byers et al., 1989;
Salom and McLean, 1989; Thoeny et al., 1992; Zolubas and Byers, 1995; Duelli et al.,
1997).
The first objective was to simulate dispersal of bark beetles using various wind and
flight parameters in order to visualize how natural dispersal distributions might appear that
otherwise are nearly impossible to observe. A second objective was to simulate the
occurrence of trees at the density of a Norway spruce forest to see what effects they might
have on flight dispersal. The ability to construct theoretical distribution patterns based on
realistic parameters may allow a better understanding of the dispersal ecology of bark beetles
and the probability of them killing trees next to outbreak centers. Finally, simulations can be
used to test results from previous studies proposing equations that predict dispersal distances
of populations based on the distribution of turning angles, number of steps, and average step
length (e.g. Kareiva and Shigesada, 1983). It might also be possible to modify or correct such
equations if they are found to diverge from the simulated reality.
2. Methods
Wind-aided bark beetle dispersal in forests or clearcuts. The algorithms
for simulating insect flight movement in two dimensions have been developed in earlier models
(Patlak, 1953; Rohlf and Davenport, 1969; Kitching, 1971; Byers, 1991, 1993, 1996a, b).
Briefly, modelled insects take steps in a forward direction with possible random deviations up
to an angle of maximum turn (AMT), either right or left at random. The flight path of an insect,
from x0,y0 to x,y is determined by calculating the insect vector using polar
coordinates from the former position based on the step size (s), or distance travelled
in one second, and former direction ( alpha in radians) plus the random angle of turn (-AMT < gamma
< AMT). The wind vector, wind speed (w) and direction (theta), is then added to
the polar coordinates of the insect vector to obtain the resulting path [i.e., x = x0 + COS(alpha + gamma)s + COS(theta)w
and y = y0 + SIN(alpha + gamma)s + SIN(theta)w]. The input
parameters of the model are dispersal time, average insect speed and step size, coordinates
of the brood tree, wind direction and speed, number of insects and the area length and width.
Initial directions of insects are chosen randomly (0 to 360° ).
In all simulations, flight speed was 2 m/s which is about what larger bark beetles such
as Ips typographus can maintain in still air (Byers 1996a). Most simulated dispersal
periods were limited to 1 hour, although these beetles on flight mills have flow up to 6 hours
(Forsse and Solbreck, 1985; Forsse, 1991). In one simulation, the dispersal times of the
population were varied about a mean of 1 hour according to a normal distribution with
standard deviation of 15 minutes (Walker, 1985). The AMT was either 10° or 20°
unless varied from quite straight (2° ) to highly random and circuitous (90° ). At the
end of each simulation period the positions of all insects were recorded for plotting and
analysis.
The dispersal patterns of distribution were visualized by constructing isolines that
encircle approximately 90 percent of the points (N). This was done by using the coordinates
of all points to calculate a center of mass (averages of x's and y's). From this center usually
N/20 pie-shaped sectors, evenly dividing 360° , were calculated, and the angles to all
points were found to determine which points were within each sector. The distances to
enclosed points within each sector then were calculated and sorted based on increasing
distance from the center. For a 90 percent isoline, an average distance was calculated from
the distances of the two points less than, and greater than, the 90th percentile of distances.
This distance was then used as a radius from the center along the middle of the sector to find
an endpoint. These endpoints were used in a three-point rolling average to form a polygon
whose area was found by summing the areas of the polygon's triangles about the center.
The dispersal patterns were further analyzed by centering the points just inside a
rectangle and then constructing a grid of cells (30 x 30) in which points were counted. The
grid cell counts were smoothed by a surrounding 9-cell rolling average and plotted as bars in
three-dimensions without perspective. The possible effects of random wind directions and
speeds were investigated with this analysis method. For example, the dispersal of 500 beetles
was simulated in a 10 x 10 km area with a grid of 50 x 50 cells (200 x 200 m each) in which
each cell had a random (0-360° ), but consistent, wind direction. A variation of this model
had cells with consistent wind vectors up to 90° left or right, at random, of an eastward
direction. Finally, wind direction and speed were varied (0-360° and 0-2 m/s) for each
beetle at each step, but with an average wind speed of 1 m/s.
Trees could affect the dispersal patterns of bark beetles. This is difficult to simulate
because there are 50,000 Norway spruce trees (0.15 m radius, 70 year plantation) in a square
km (Magnussen, 1986) or 5 million in a 10 x 10 km area needed for simulating dispersal for
an hour. The array needed to hold and search these tree coordinates requires more memory
and speed than possible with program software and personal computers. However, the task
was accomplished by simulating one beetle at a time, many times, and placing a radial area
of forest centered on the beetle at the start. The area's radius was 50 m and within this area
393 trees are expected (Magnussen, 1986). The trees were spaced apart at least 50 percent
of the maximum hexagonal spacing possible, a distance equal to a minimum allowed distance
(MAD) of 2.4 m between trees (Byers, 1984, 1992).

| 15 insects disperse outward at 10 m steps in a 100 m radius area which
has 100 trees, each of 4 m radius, spaced at least 50% of the maximum spacing
possible (1.0746 / SQR(#trees/area) * 0.5) or at least 9.52 m apart in this case.
The flight paths in blue show the insects avoiding the green trees (image at left was made
from an actual simulation in BASIC, note that this GIF and yellow text box are not part of original paper). |
|---|
Trees were also spaced this distance or
more from the beetle at the center, but otherwise the trees were placed at random within
these constraints. The beetle was then allowed to move as above. However, if it would have
struck a tree trunk (algorithm in Byers, 1991) according to the flight and wind vectors, then an
algorithm picks an angle ā (0.57° ) either left or right at random from the former flight
angle and tests this flight angle. If the beetle still would strike the tree, then the angle ā is
expanded incrementally (0.57° ), but alternating left and right from the former flight angle,
until the beetle misses the trunk. This means that beetles will pass by the tree either left or
right in a realistic way usually according to which side of the tree they tended toward initially.
The beetle continues until eventually passing out of the circular area, whereupon a new
set of 393 spaced trees is centered about the beetle (using the same memory array). This
requires little memory and speeds the searches of tree coordinates by 12,723 times compared
with searching 5 million pairs (requiring 80 MB memory). All simulations and graphical
analyses were done using a combination of QuickBASIC 4.5 and PostScript 2.0 programming
languages.
Equations predict mean dispersal distance. During the studies, I
wondered whether it is possible to use an equation to predict the average distance of
dispersal of a population of animals from a release point given: (1) the step size (or average
step size), (2) the number of steps, and (3) the AMT. The average distance of dispersal and
variance can be found by simulation to check the validity of any such equation. The equation
of Kareiva and Shigesada (1983) uses move lengths, turning angles, and total moves to
calculate dispersal distances. However, their formula gives the expected mean squared
dispersal distance, E(R2n):

where L is the step size (since L is constant then E(L2)
= E(L)2 = L2 ), n is the number of steps, and
c is the average of the cosines of all possible turning angles (in radians) from a
specified random distribution:

The mean squared dispersal distance, unfortunately, is difficult to compare to the
intuitively more meaningful mean dispersal distance. Assuming a uniform distribution
of random angles between -AMT and AMT, I calculate a mean c from the AMT
(converted to radians, AMT*ã/180) by summing the cosines of é in incremental steps
of 2*AMT/i (where i = 20,000) from -AMT to AMT and dividing the sum
by the number of iterations:

The problem is now to use the mean square distance of Kareiva and Shigesada
(1983) from equation (1) using c from (3) to find the mean dispersal distance.
A first approximation is to take the square root, but this overestimates the actual mean
distance found by simulation by up to 12.4%.
Simulations using various step sizes, and varying both the number of steps (X)
and the AMT (Y, from 0 to 180° ) stepwise, were used to calculate the mean
distance of dispersal with the pythagorean formula (averages of 4 simulations of 1000
points at each X,Y). It is then possible to compare the resulting distances to
square roots of expected mean square distances based on equations (1) and (3) using
appropriate parameters. The comparisons were used to find correction factors (which
vary with number of steps and AMT) based on the ratio of the simulated values and
the calculated square root values.
3. Results
Wind-aided bark beetle dispersal in forests or clearcuts. An
increase in the angle of maximum random turn (AMT) caused the area of distribution
of simulated bark beetles enclosed by a 90% isoline to decrease proportional to the
reciprocal of the AMT squared (Y = 3609X-2.03, R=1.00), but had no affect
on the center of the distribution relative to the brood tree source (Fig. 1).
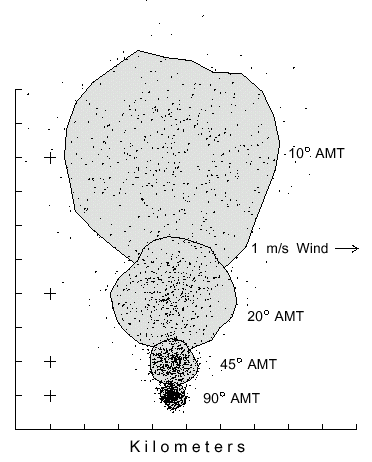
Fig. 1. Dispersal patterns of 500 simulated bark beetles flying from a source (pluses
at left) in 1 m/s wind (from left) for 1 hour with different flight angles of maximum turn
(AMT). Beetles took steps of 2 m (2 m/s speed), and at each step they could turn
either left or right up to a maximum of 10, 20, 45 or 90° at random. The largest
polygon includes 90% of the beetles having an AMT of 10° in an area of 31.9
km2. The beetles with flight AMT's of 20, 45 and 90° are enclosed in areas of
9.1, 1.4, and 0.4 km2, respectively.
The average distance beetles flew away from the center of mass (or from the brood
tree in still air) after 1 hour is expressed as a reciprocal relation of the AMT (Y =
21.377X-1.02, R=1.00). The constant wind speed and direction affected all
beetles similarly so the patterns were all symmetrical and drifted to the same position
as shown by the equivalent positions of the centers of mass (Fig. 1). Simulations
showed that the patterns were the same relative size and symmetry regardless of wind
speed, which only caused the `centers of mass' to drift more rapidly. The convex
polygon area containing about 90% of the 500 simulated beetles ranged from 31.9
km2 (or about 6.4 km diameter) for reasonably "normal-flying" beetles
(10° AMT) to only 0.4 km2 (0.7 km diameter) for the highly circuitous-
flying ones (90° AMT).
Given that beetles all had random turning angles less than 20° right or left, an
increase in time of dispersal caused a linear increase in the area of distribution of simulated
bark beetles (Fig. 2; Y = -0.46 + 9.547X, R=1.00).
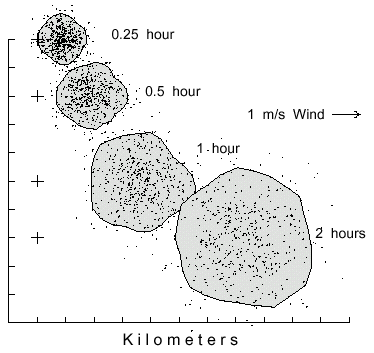
Fig. 2. Dispersal patterns of 500 simulated bark beetles flying from a source (pluses at left)
in 1 m/s wind (from left) for different time periods. Beetles took steps of 2 m (2 m/s speed),
and at each step they could turn either left or right up to a maximum of 20° at random.
The largest polygon includes 90% of the beetles having flown for 2 hours to cover an area of
18.3 km2. The beetles flight periods of 0.25, 0.5, and 1 hour are enclosed in areas of 2.2, 4.2,
and 9.6 km2, respectively.
As expected, the average distance traveled in 1 hour by beetles away from the center of
mass, or brood tree in still air, is expressed in relation to the square root of time (Y =
1.05X0.516, R2=1.00; Gamov and Cleveland, 1969). The 90% isoline
polygon at 0.25 hours dispersal covered an area of 2.2 km2 which increased to 18.3
km2 after 2 hours of dispersal. The centers of mass also drifted farther downwind
with more time (about 7.2 km in 2 hours, Fig. 2). If the AMT was held constant at 20°
and the time at 1 hour, then not surprisingly an increase in wind speed has no affect on the
area of distribution, being about 9.0± 0.6 km2 (± 95% C.L.) at any wind
speed (Fig. 3). However, the centers of the distributions drifted farther with higher wind speeds
(Fig. 3).
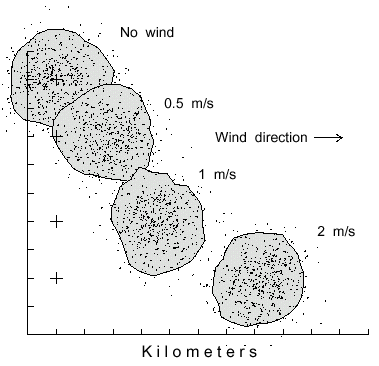
Fig. 3. Dispersal patterns of 500 simulated bark beetles flying from a source (pluses at left)
for 1 hour in different wind speeds, from left to right. Beetles took steps of 2 m (2 m/s speed),
and at each step they could turn either left or right up to a maximum of 20° at random.
The polygons include 90% of the beetles having flown in various wind speeds of 0, 0.5, 1, and
2 m/s to disperse over similar areas of 9.3, 9.2, 9.0, and 8.4 km2, respectively.
Initially beetles dispersing from a point source would fly out in all directions. If the flight
direction was nearly straight (AMT = 2° ) then a concentric ring of points would flow
outward as seen after 1 hour in Fig. 4A. The density of points in the ring along a radial
transect approximates a normal curve. Eventually, beetles by random turns can fly back
toward the source. This happens more often if the AMT is larger at 10° in which the
density distribution becomes a three-dimensional bell-shaped curve (Fig. 4B). A constant wind
direction and wind speed does not affect the dimensions of the density distributions.
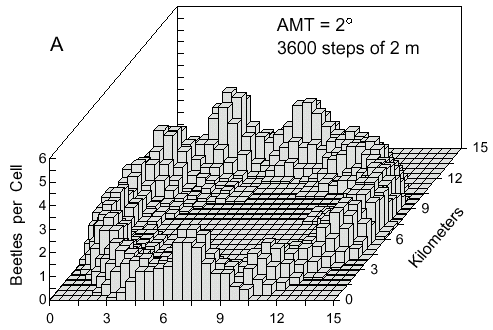
Fig. 4. A. Cell counts (9-cell rolling average) of 500 simulated bark beetles after dispersal from
a point source for 1 hour. Beetles flew at 2 m/s and at each step of 2 m they could turn either
left or right at random up to a maximum of 2° .
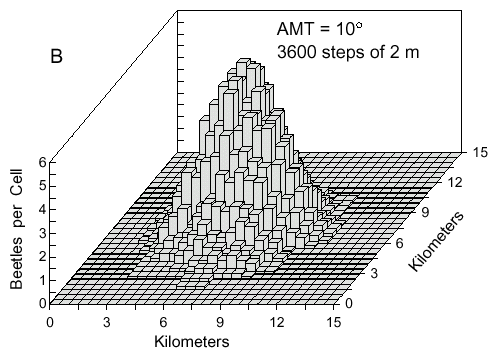
Fig. 4. B. The same conditions except that
beetles took random turns with deviations up to 10° from straight ahead.
An attempt to influence the density distributions by variable wind directions was done
by placing a grid of 2500 cells (200 m square) in which each had a random wind direction that
was constant during the period. The density distribution was virtually unaffected when wind
speed was 1 m/s (compare Fig. 5 to Fig. 4B). If the wind speed is made more than the flight
speed of 2 m/s then beetles can be forced along the narrow boundaries of the cells when two
wind vectors oppose each other. This situation seems unnatural and so is not considered
further. Finally, a highly random scenario was simulated in which wind direction varied at
random for each beetle at each step, and also the wind speed was varied at random up to 2
m/s (average 1 m/s). Again, the density distribution or diameter of the area was not
significantly affected.
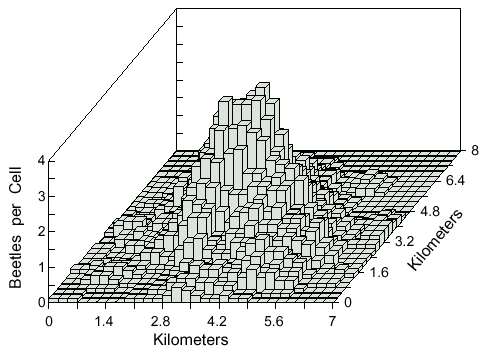
Fig. 5. Cell counts (9-cell rolling average) of 500 simulated bark beetles after dispersal from
a point source for 1 hour. Beetles flew from a source centered in a 10 x 10 km area with a
50 x 50 grid of 200 x 200 m cells each with a random, but consistent, wind direction of 1 m/s
velocity. Beetles flew at 2 m/s and at each step of 2 m they could turn either left or right up
to a maximum of 10° at random.
Individuals of a population of bark beetles are expected to vary in fat content and flight
range according to a normal distribution. Therefore, simulated insects were allowed to vary
in flight duration about a mean of 1 hour with a standard deviation of 15 minutes (Fig. 6).
Compared to an exact flight duration of 1 hour, the variable range insects became distributed
over a slightly larger area (90% isoline of 36.8 km2 vs. 30.7 km2; mean
distance from center of mass of 2.14 vs 2.01 km). Otherwise there were little differences in
spatial distribution or downwind movement (Fig. 6).
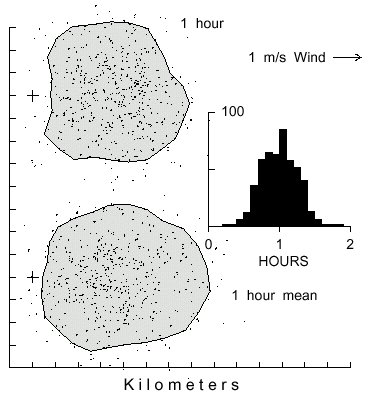
Fig. 6. Dispersal patterns of 500 simulated bark beetles flying from a source (pluses at left)
in 1 m/s wind (from left) for 1 hour (top polygon) or for a mean of 1 hour with normal variation
(SD = 15 min., bottom polygon). Inset frequency histogram pertains to bottom polygon.
Beetles took steps of 2 m with random turns at each step either left or right up to a maximum
of 10° . The top and bottom polygons include 90% of the beetles and cover an area of
30.7 and 36.8 km2, respectively.
The presence of 5 million Norway spruce trees (0.15 m radius, 70 years) in a 10 x 10
km area (Magnussen, 1986) had a subtle affect on the paths and reduced somewhat the
dispersion area of the simulated beetles. After 1 hour of dispersal in a 1 m/s wind, 100 bark
beetles in the simulated forest had a 90% isoline area of 25.3 km2 and moved
downwind an average of 2.85 km (Fig. 7A). In comparison, the same beetles in an open field
covered more area 30.8 km2 and moved further downwind at 3.53 km (Fig. 7B).
Using 10 simulations of 500 beetles each for each type, the `forest' beetles covered an
average 90% isoline area of 30.94± 0.98 km2 (± 95% C.L.) and drifted
on average 2.93± 0.05 km downwind compared to dispersal in an open area covering
34.81± 1.13 km2 and moving 3.57± 0.06 km downwind (means
significantly different P< 0.001, t-test). The average dispersal distance from the center of
mass was 1.98± 0.03 km in the forest and was significantly less than 2.08± 0.04
km in the open (P< 0.001). These results indicate that the trees reduced the dispersal
area by about 11%, the downwind drift by 18%, and the average dispersion distance from the
center of mass by 5%.
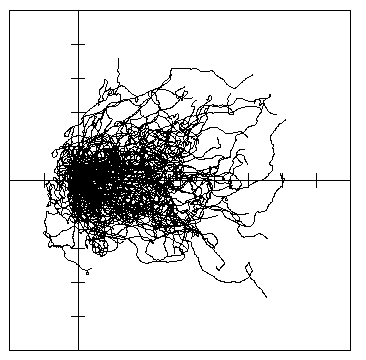
Fig. 7. A. Dispersal paths of 100 simulated bark beetles flying from a source (at cross in lines)
for 1 hour in 1 m/s wind (left to right) in a 10 x 10 km forest of 5 million trees. Beetles took
steps of 2 m (2 m/s speed), and at each step they could turn either left or right up to a
maximum of 10° at random. The 90% isoline polygon of dispersion was 25.2 km2, the
center of mass drifted 2.85 km downwind from the release, and the average distance beetles
traveled from the center of mass was 1.85 km.

Fig. 7. B. Dispersal paths of 100 simulated bark
beetles flying from a source (at cross in lines) for 1 hour in 1 m/s wind (left to right) in a 10
x 10 km open area. Beetles took steps as in A. The 90% isoline polygon of dispersion was
30.8 km2, the center of mass drifted 3.53 km downwind from the release, and the average
distance beetles traveled from the center of mass was 2.00 km.
Simulations of varying densities of Norway spruce trunks, from 0 to 1000 trees within
the 50 m radius about a beetle, shows that the average dispersal distance downwind (m)
decreases as a linear function of tree density (Y = 588.2 - 0.1326X, R2=0.97, Fig.
8). Also, the average dispersal distance (m) from the center of mass (Y = 762.5 - 0.0549X,
R2=0.98) and the 90% isoline area (km2) (Y = 3.0576 - 0.000232X,
R2=0.96) decreases linearly with tree density (Fig. 8). The paths of beetles were
more twisting at the higher trunk densities (Fig. 8) due to the need to more often avoid trees,
the same effect as if the angle of maximum turn (AMT) had been made larger (as in Fig. 1).
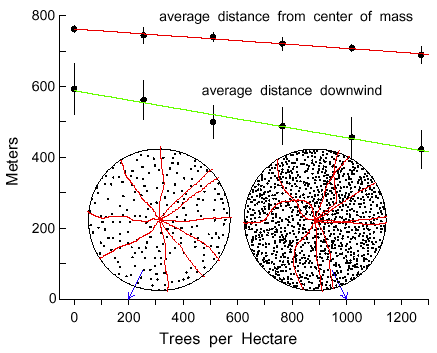
Fig. 8. Average dispersal distances either downwind from a source or from the calculated
center of mass of 200 simulated bark beetles flying in Norway spruce forests of different trunk
densities. Bars represent 95% confidence limits for a mean of 5 simulations. Beetles flew at
2 m/s for 10 minutes, taking steps of 2 m with turns at each step either right or left up to a
maximum of 10° at random. Beetles turned when encountering spruce tree trunks of
0.15 m radius, as shown in circular regions of 50 m radius. Initial paths of 10 beetles, released
uniformly, are shown in regions with 200 and 1000 trees.
Equations predict mean dispersal distance. The equations of Kareiva and
Shigesada (1983) for mean square dispersal distances gave square root values very similar,
but not always, to simulation results (actual mean dispersal distances). The comparisons
show that for a large number of steps (n > 5000), the actual dispersal distance is
actually about 0.89 of the square root of the expected mean square distance from the formula.
Also, when the AMT is above 30° the correction factor stabilizes at 0.89. Interestingly,
there is a complex interplay between the AMT and number of steps which makes it necessary
to describe the correction factor (about 0.89 above) as a three-dimensional surface at angles
< 30° and steps < 5000 (Fig. 9).
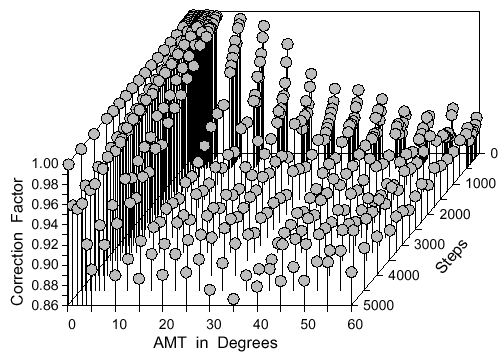
Fig. 9. Correction factor as a three dimensional surface function of the number of steps and
the angle of maximum turn (AMT) at each step. The mean dispersal distance is obtained by
multiplying the correction factor by the square root of the expected mean square dispersal
distance. Points represent averages of four simulations of 1000 points each. See text for the
best-fitting multivariate cubic polynomial equation.
The step size surprisingly has no affect on the correction factor. The surface equation of the
correction factor (Z) can be described reasonably well by a multivariate least squares cubic
polynomial:

where a = -1.123E-12, b = 9.27E-9, c = -2.663E-5, d = 1.464E-10,
e = -2.38E-6, f = 6.449E-8, g = -5.695E-3, h = 1.677E-4, and
i = -3.227E-6 (MATHCAD, MathSoft Inc.). However, the fit is best over a limited range,
therefore five constraints applied in order improve the fit: (1) if Z < 0.89 then Z = 0.89,
(2) if Z > 1 then Z = 1, (3) if AMT > 30° then Z = 0.89, (4) if number of steps
> 5000 then Z = 0.89, and (5) if AMT > 20 AND steps > 2000 then Z = 0.89.
Thus, the mean dispersal distance is found from equations (1), (3) and (4). For
example, if L = 2 m, n = 1000 steps, and AMT = 30° or 0.5236 radians,
then c = 0.9549 from equation (3) and the mean square dispersal distance is 169,752
m from (1) and the mean dispersal distance (MDD) is:

where Z = 0.89 from equation (4) and constraints. Five simulations with the same parameters
and 1000 insects each gave a mean dispersal distance of 364.0 ± 5.3 m (95% C.L.).
4. Discussion
The dispersal patterns shown in Figs. 1-6 are similar to expected point distributions based on
earlier studies of correlated random walks and diffusion models (Okubo 1980). The results of
dispersion of bark beetles differ only because of the specific parameters for flight duration
(number of steps), step size (or frequency of possible turn) and the angle of turn taken at
random, either left or right, within an angle of maximum turn (AMT). Earlier simulations of
animal movements have either used random turns of increments of 45 or 90° on a
lattice (Rohlf and Davenport, 1969; Gries et al., 1989; Johnson et al., 1992), a uniform random
distribution within a range of AMT (Byers, 1991, 1993, 1996a, b, 1999; Kindvall, 1999), or
random turns using a normal distribution with a specified standard deviation (Cain, 1985;
Weins et al., 1993). At least for the latter two methods, the resulting distributions after
dispersal can be made nearly identical by adjusting the AMTs and standard deviations of
turning angles appropriately (Byers, unpublished).
The turning angle and step size parameters are difficult to measure for flying bark
beetles and may be complicated by the scale chosen for measurement due to habitat
heterogeneity and periodic behavioral changes (Kaiser, 1983; Cain, 1985; Turchin, 1991;
Johnson et al., 1992; Crist et al., 1992; Weins et al., 1993; With and Crist, 1996). However,
if the movement is regular as might occur in a uniform habitat, then the scale chosen is not
critical over large ranges since smaller divisions of the path give smaller angles of turn while
larger division yield larger angular deviations. This can be easily seen in simulations where
approximately the same paths can be constructed from larger steps and larger possible
turning angles as from smaller steps and appropriately smaller turning angles.
The simulation of dispersal in a `natural' forest of tree trunks shows that the trunks
deflect beetles enough to reduce the dispersal area of the population about 11% compared
with no trunks (Fig. 7A and B). This is similar in effect to increasing the AMT of beetles (Fig.
1). Interestingly, the dispersal distance downwind, the dispersal distance from the center of
mass, and the 90% isoline area (not shown) all decrease as linear functions of trunk density
(Fig. 8). Part of the observed reduction in dispersal rates of populations and the encounter
rates between predators and prey in heterogenous environments (Kaiser, 1983; Johnson et
al. 1992; Crist et al., 1992; With and Crist, 1996) can be due to avoidance of obstacles as
shown here, or due to attractive or arresting properties of the obstacles (e.g., food
items).
The results of flight mill studies with larger bark beetles (Atkins, 1961; Forsse and
Solbreck, 1985; Forsse 1991; Jactel and Gaillard, 1991) indicate that these beetles which fly
at about 2 m/s could travel up to 45 km. The models here reveal the potential extent that bark
beetles, and similar insects, can disperse in a relatively short time of one hour. In regard to
bark beetle epidemics, truly laminar wind of either consistent or variable direction (even highly
random in patches) has no affect on the shape or extent of the dispersal area other than
causing the point pattern to drift in unidirectional wind (Fig. 3). In nature, of course, wind-aided
dispersal is probably more complicated. First of all, wind is usually not laminar but because
of topography may flow in ways to separate and transport beetles into different regions.
Beetles may settle after different flight durations which will tend to increase the dispersal area
in wind (Fig. 6). There is some evidence from field traps that beetles avoid both clearcuts and
deep forest, preferring the edges of forests - thus further disrupting the theoretical dispersal
patterns (Botterweg, 1982; Byers, unpublished). Recently, the spruce bark beetles Ips
typographus and Pityogenes chalcographus have been shown to avoid volatiles of
nonhost birch trees (both from bark and leaves) which suggests the possibility that beetles
may not enter areas of primarily birch (Byers et al. 1998).
The dispersal flight of a bark beetle may vary from only a few meters (as observed
during epidemics) to possibly several kilometers. Several factors interact to cause the
dispersal flight distance to vary between individuals. The most obvious is that a beetle
encounters a susceptible tree early in the dispersal flight. However, whether this tree is
attacked may depend on the level of fat reserves that can be mobilized for flight (Atkins, 1966,
1969; Byers 1999). A beetle should have higher reproductive fitness if it flies rather far from
the brood tree since it can both avoid inbreeding with siblings and, more importantly in my
view, escape predators and parasites that are locally more dense near the brood tree. Thus,
the dispersal distance has been optimized over evolutionary time to balance the probably
logarithmically increasing benefits of flying farther against the probably exponentially
increasing likelihood of exhaustion and failing to find a host. The fat level required for lengthy
dispersal will depend on the conditions in the brood tree during larval development, for
example, disease, insect, and climatic factors will affect the nutritional quality of the host.
Severe competition among the larvae will reduce the size of adults as well as their fat content
(Atkins, 1975; Anderbrant et al., 1985). Parasites would reduce the size and fat content of
some adults while predators would lessen competition for those remaining locally, thereby
increasing the variability of dispersal range in the population. The population density of bark
beetles should be stabilized by a frequency-dependant competition for the susceptible trees
that would produce increasingly stronger, longer-flying individuals with decreasing attack and
larval density while giving weaker, shorter-flying ones with increasing competition.
Pioneer bark beetles find susceptible trees either by landing at random or by response
to volatiles from damaged or weakened trees. Most species that have an aggregation
pheromone appear not attracted, or only weakly, by host volatiles (Byers, 1995). For these
species, it is not known if there are two types of beetles, one that behaves as a pioneer and
tests trees for susceptibility, and another type that only searches for aggregation pheromone
and trees undergoing colonization. Most likely, all beetles have a strategy that depends on the
level of their fat reserves (Byers, 1999). At higher fat reserves during the period immediately
after emerging, the beetle disperses and ignores host trees and pheromone, but as the fat
reserves are depleted both trees and pheromone become increasingly attractive (Atkins, 1966;
Gries et al., 1989; Borden et al., 1986; Byers, 1999). Finally, if no pheromone is present the
beetle may test any tree at random in the desperate hope of landing on a susceptible tree
(Byers 1995, 1996a, 1999).
If the pioneer beetle is fortunate to land on a tree of low resistance that can not
produce sufficient resin to repel the beetle, then it has time to feed and excrete pheromone
components with the fecal pellets. This then functions as a beacon to the population in the
surrounding area that a weakened host can be exploited as a food and mate resource (Byers,
1996a). Aggregation pheromone is an evolutionarily adaptive signal since only trees too weak
to vigorously repel beetles with resin will allow beetles to produce pheromone and joining
beetles will likely suffer little mortality. Some species, usually termed less aggressive ones,
such as the European pine shoot beetle, Tomicus piniperda, are attracted to volatiles
produced after injury to the host tree by biotic or abiotic factors that indicate susceptibility
(Byers 1995; 1996a).
Whether larger bark beetles can disperse in the manner described in the models is not
known since these beetles have not been observed in flight over any appreciable distance
while seeking hosts. However, in addition to the accounts about D. brevicomis
mentioned earlier (Miller and Keen, 1960), I. typographus appears to have migrated
as in the models. An infestation of these beetles in several hectares on the side of a valley
in the Harzt Mountains, Germany, was surrounded by uninfested spruce forest for several km
until the following season when the beetles probably left en masse and flew about 1.5 to 2 km
downwind to attack an area of some 20 ha killing hundreds of trees in several scattered
groups on the other side of the valley (H. Niemeyer, personal communication).
Control strategies that attempt to contain epidemic populations of bark beetle by use
of trap trees or pheromone-baited traps in border zones must consider the potentially wide
dispersal areas, especially in mild winds, that can result. A border area of only 500 to 1000
m width, as proposed for containment of the I. typographus outbreak in the Bayerischer
Wald National Park of Germany (Schröter, 1998), may likely be inadequate. However, the
dispersing population from an epidemic area, where severe competition has reduced the fat
content for extended flight, may respond to host and pheromone after a short flight so that
narrower border zones of treatments would be effective in stopping the spread.
Earlier studies have investigated whether it is possible to use an equation to predict
the average distance of dispersal of a population of animals from a release point given (1) the
step size (or average step size), (2) the number of steps, and (3) the AMT. The well-known
diffusion equation for two dimensions (Pielou 1977, Okubo 1980, Rudd and Gandour 1985)
predicts the density of organisms at any distance from the release point after a certain time
or number of steps, but only for random walks (AMT = 180° ). Insects and many other
organisms do not exhibit truly random or Brownian movement but rather show correlated
random walks in which the previous direction influences the direction of the next step. Patlak
(1953) reports a modification of the Fokker-Planck equation that can predict densities of points
at any distance and time for correlated random walks where the average angle of turn is
known. However, his equation (42) is exceeding complex in my view and thus has not been
used in practice. Turchin (1991) took the Patlak equation for one dimension and "simplified"
it in his work on patch density transitions. His equation is still complex and difficult to use, and
it is not as yet applicable in two dimensions.
The equation of Kareiva and Shigesada (1983) comes close to calculating the mean
distance of dispersal when move lengths, turning angles, and total moves are known.
However, their formula gives the expected mean squared dispersal distance which obviously
is much larger than the intuitively meaningful, mean dispersal distance. By taking the square
root of the mean squared dispersal distance, this value still overestimates the actual mean
dispersal distance of a population (simulated population) by up to 12.4%. Only for animals with
a straight path (AMT = 0° ) do the formula square root and simulation values become
identical, for all other turning angle distributions and numbers of steps, the square root of the
formula values give incorrect results. However, correct mean dispersal distances can be found
by multiplying correction factors from the three dimensional surface equation from simulated
results (equations 4 and 5) by the square root of the formula values. This means that instead
of using longer running simulations of many points, the mean dispersal distance can be
predicted using equations with only the mean step size, number of steps, and AMT.
The dispersal program software is available from the author for IBM-compatible
personal computers by downloading (BB-DISP.ZIP) from the Internet URL:
http://www.wcrl.ars.usda.gov/cec/software.htm .
Acknowledgements
This work was initiated after discussions supported by the "Bayerische Landesanstalt für Wald
und Forstwirtschaft" about the large outbreak of Ips typographus in the Bayerischer
Wald National Park. I am grateful to Jörgen Jönsson who encouraged my further refinements
of the model. The work was supported by a grant from the Swedish Agricultural and Forest
Research Council (SJFR).
References
Anderbrant, O., Schlyter, F. and Birgersson, G. 1985. Intraspecific competition affecting
parents and offspring in the bark beetle Ips typographus. Oikos, 45: 89-
98.
Atkins, M.D., 1961. A study of the flight of the Douglas-fir beetle Dendroctonus
pseudotsugaeHopk. (Coleoptera: Scolytidae) III. Flight capacity. Can. Entomol., 93:
467-474.
Atkins, M.D., 1966. Laboratory studies on the behaviour of the Douglas-fir beetle,
Dendroctonus pseudotsugae Hopkins. Can. Entomol., 98: 953-991.
Atkins, M.D., 1969. Lipid loss with flight in the Douglas-fir beetle. Can. Entomol., 101: 164-
165.
Atkins, M.D., 1975. On factors affecting the size, fat content and behavior of a scolytid. Z.
Angew. Entomol., 78: 209-218.
Austarå, O., Annila, E., Bejer, B. and Ehnström, B., 1984. Insect pests in forests of the Nordic
countries 1977-1981., Fauna Norv. Ser. B., 31: 8-15.
Borden, J.H., Hunt, D.W.A., Miller, D.R. and Slessor, K.N., 1986. Orientation in forest
Coleoptera: an uncertain outcome of responses by individual beetles to variable
stimuli. Mechanisms in Insect Olfaction. T.L. Payne, M.C. Birch, and C.E.J.
Kennedy. Oxford, Clerendon Press, pp 97-109.
Botterweg, P.F., 1982. Dispersal and flight behaviour of the spruce bark beetle Ips
typographus in relation to sex, size and fat content. Z. Angew. Entomol., 94: 466-
489.
Byers, J.A., 1984. Nearest neighbor analysis and simulation of distribution patterns indicates
an attack spacing mechanism in the bark beetle, Ips typographus (Coleoptera:
Scolytidae). Environ. Entomol., 13: 1191-1200.
Byers, J.A., 1991. Simulation of mate-finding behaviour of pine shoot beetles, Tomicus
piniperda. Anim. Behav., 41: 649-660.
Byers, J.A., 1992. Dirichlet tessellation of bark beetle spatial attack points. J. Anim. Ecol.,
61: 759-768.
Byers, J.A., 1993. Simulation and equation models of insect population control by
pheromone-baited traps. J. Chem. Ecol., 19: 1939-1956.
Byers, J.A., 1995. Host tree chemistry affecting colonization in bark beetles. In: R. T. Cardé
and W. J. Bell (Editors), Chemical Ecology of Insects II. Chapman and Hall,
New York, pp. 154-213.
Byers, J.A., 1996a. An encounter rate model for bark beetle populations searching at random
for susceptible host trees. Ecol. Model., 91: 57-66.
Byers, J.A., 1996b. Temporal clumping of bark beetle arrival at pheromone traps: Modeling
anemotaxis in chaotic plumes. J. Chem. Ecol., 22: 2133-2155.
Byers, J.A., 1999. Effects of attraction radius and flight paths on catch of scolytid beetles
dispersing outward through rings of pheromone traps. J. Chem. Ecol., 25: 985-
1005.
Byers, J.A., Anderbrant, O. and Löfqvist, J., 1989. Effective attraction radius: A method for
comparing species attractants and determining densities of flying insects. J. Chem.
Ecol., 15: 749-765.
Byers, J.A., Zhang, Q.H., Schlyter, F. and Birgersson, G., 1998. Volatiles from nonhost birch
trees inhibit pheromone response in spruce bark beetles. Naturwissenschaften, 85:
557-561.
Cain, M.L., 1985. Random search by herbivorous insects: a simulation model. Ecology, 66:
876-888.
Crist, T.O., Guertin, D.S., Wiens, J.A. and Milne, B.T., 1992. Animal movement in
heterogenous landscapes: an experiment with Eleodes beetles in shortgrass
prairie. Func. Ecol., 6: 536-544.
Duelli, Von P., Studer, M. and Näf, W., 1986. Der Borkenkäferflug auserhalb des Waldes. J.
Appl. Entomol., 102: 139-148.
Duelli, P., Zahradnik, P., Knizek, M. and Kalinova, B., 1997. Migration in spruce bark beetles
(Ips typographus L.) and the efficiency of pheromone traps. J. Appl. Entomol.,
121: 297-303.
Forsse, E., 1991. Flight propensity and diapause incidence in five populations of the bark
beetle Ips typographus in Scandinavia. Entomol. Exp. Appl., 61: 53-58.
Forsse, E. and Solbreck, C., 1985. Migration in the bark beetle Ips typographus
duration timing and height of flight. Z. Angew. Entomol., 100: 47-57.
Gamov, G. and Cleveland, J.M., 1969. Physics Foundations and Frontiers. Prentice-
Hall, Inc.Englewood Cliffs, New Jersey.
Gara, R.I., 1963. Studies on the flight behavior of Ips confusus (LeC.)(Coleoptera:
Scolytidae)in response to attractive material. Contrib. Boyce Thompson Inst., 22: 51-
66.
Gara, R.I. and Vité, J.P., 1962. Studies on the flight patterns of bark beetles (Coleoptera:
Scolytidae) in second growth ponderosa pine forests. Contrib. Boyce Thompson Inst.,
21: 275-289.
Gries, G., Nolte, R. and Sanders, W., 1989. Computer simulated host selection in Ips
typographus. Entomol. Exp. Appl., 53: 211-217.
Helland, I.S., Hoff, J.M. and Anderbrant, O., 1984. Attraction of bark beetles (Coleoptera:
Scolytidae) to a pheromone trap: experiment and mathematical models. J. Chem.
Ecol., 10: 723-52.
Jactel, H. and Gaillard, J., 1991. A preliminary study of the dispersal potential of Ips
sexdentatus Boern (Coleoptera: Scolytidae) with an automatically recording flight
mill. J. Appl. Entomol., 112: 138-145.
Johnson, A.R., Milne, B.T. and Wiens, J.A., 1992. Diffusion in fractal landscapes: simulations
and experimental studies of tenebrionid beetle movements. Ecology, 73: 1968-
1983.
Kaiser, H., 1983. Small scale spatial heterogeneity influences predation success in an
unexpected way: model experiments on the functional response of predatory mites
(Acarina). Oecologia, 56: 249-256.
Kareiva, P.M. & Shigesada, N., 1983. Analyzing insect movement as a correlated random
walk. Oecologia, 56:234-238.
Kindvall, O., 1999. Dispersal in a metapopulation of the bush cricket, Metrioptera
bicolor(Orthoptera: Tettigoniidae). J. Anim. Ecol., 68: 172-185.
Kitching, R., 1971. A simple simulation model of dispersal of animals among units of discrete
habitats. Oecologia, 7: 95-116.
Magnussen, S., 1986. Diameter distributions in Picea abies described by the Weibull
model. Scand. J. For. Res., 1: 493-502.
Meyer, H.J. and Norris, D.M., 1973. A mathematical relation to describe the influence of wind
on the initial flight dispersal of Scolytus multistriatus (Coleoptera: Scolytidae).
Ann. Entomol. Soc. Am., 66: 505-508.
Miller, J.M. and Keen, F.P., 1960. Biology and Control of the Western Pine Beetle.
USDA misc. pub. # 800, 381 pp.
Nilssen, A.C., 1978. Development of a bark fauna in plantations of spruce (Picea abies
[L.] Karst.) in north Norway. Astarta, 11: 151-169.
Okubo, A., 1980. Diffusion and Ecological Problems: Mathematical Models. Springer-Verlag.
Berlin.
Patlak, C.S., 1953. Random walk with persistence and external bias. Bull. Math. Biophys.,
15: 311-338.
Pielou, E.C., 1977. Mathematical Ecology. John Wiley & Sons, New York.
Ricklefs, R.E., 1990. Ecology. W.H. Freeman and Company, New York.
Rohlf, F.J. and Davenport, D., 1969. Simulation of simple models of animal behavior with a
digital computer. J. Theoret. Biol., 23: 400-424.
Rudd, W.G. and Gandour, R.W., 1985. Diffusion model for insect dispersal. J. Econ. Entomol.,
78: 295-301.
Salom, S.M. and McLean, J.A., 1989. Influence of wind on the spring flight of
Trypodendron lineatum (Oliver)(Coleoptera: Scolytidae) in a second-growth
coniferous forest. Can. Entomol., 121: 109-119.
Schröter, H., 1998. "Borkenkäferproblematik im Nationalpark Bayerischer Wald" In: C. Wild,
J. Metzger and C. Strauss (Editors), Borkenkäferproblematik im Nationalpark
Bayerischer Wald. Bayerische Landesanstalt für Wald und Forstwirtschaft, pp. 16-
19.
Thoeny, W.T., Tiarks, A.E., Hayes, J.L. and Bridges, J.R., 1992. Marking the southern pine
beetle (Coleoptera: Scolytidae) with rubidium with loblolly pine for dispersal studies.
Environ. Entomol., 21: 1377-1385.
Turchin, P., 1991. Translating foraging movements in heterogeneous environments into the
spatial distribution of foragers. Ecology, 72: 1253-1266.
Walker, R.S., 1985. Understanding Computer Science - Vol. II. Texas Instruments Inc.,
Dallas, Texas.
Weins, J.A., Crist, T.O. and Milne, B.T., 1993. On quantifying insect movements. Environ.
Entomol., 22: 709-715.
With, K.A. and Crist, T.O., 1996. Translating across scales: Simulating species distributions
as the aggregate response of individuals to heterogeneity. Ecol. Model., 93: 125-
137.
Zolubas, P. and Byers, J.A., 1995. Recapture of dispersing bark beetles, Ips
typographus L.(Col., Scolytidae) in pheromone-baited traps: regression models. J.
Appl. Entomol., 19: 285-289.
Zumr, V., 1992. Dispersal of the spruce bark beetle Ips typographus (L.)(Col.,
Scolytidae) in spruce woods. J. Appl. Entomol., 114: 348-352.


 Abstract
see it in


