Byers, J.A. 1984. Electronic Multiprobe Thermometer and Multiplexer for Recording Temperatures of Microenvironments in the Forest Litter Habitat of Bark Beetles (Coleoptera: Scolytidae) Environmental Entomology 13:863-867. pdf

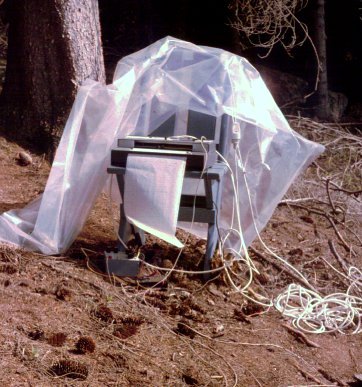
Recording 4 temperatures in Norway spruce duff with multiplexed electronic thermometers - Skien, Norway
Figure: Recording temperatures at 4 depths in Norway spruce, Picea abies, duff with integrated circuit thermometers sharing a strip chart recorder by means of multiplexed electronic switches.

ABSTRACT - An electronic integrated-circuit thermometer with multiple probes (3 by 4 by 5 mm each) is described and was used to measure temperatures at the surface and at several depths in the forest litter of Norway spruce, Picea abies (L.) Karst., throughout 3 days in spring. The temperatures at the various depths were recorded on a single-pen recorder/voltmeter by means of a multiplexing circuit which in turn connected each of four or more sensor probes to the amplifying circuit and pen recorder for a specific amount of time. This scanning time per probe can be adjusted from 1 s to about 1 h. The possible effects of temperature in the forest litter on the survival and flight initiation of bark beetles, especially Ips typographus (L.), during their spring swarming is discussed.

SINGLE-PROBE digital thermometers are not expensive, but models which can record up to eight temperatures at the same time cost considerably more (several hundred dollars). The automatic recording of temperatures on a strip-chart recorder is convenient for single thermometers; however, multichannel recorders usually cost more than twice as much. Automatic signal scanners (multiplexing signal input) are one solution to the problem of cost, but they also typically cost several hundred dollars. The multiprobe thermometer and multiplexing circuit that I describe here is an "all-in-one" unit, which, when combined with a single-channel recorder, is very inexpensive and relatively simple to build.

In order to demonstrate the capabilities and usefulness of the device, I placed it in a Norway spruce forest, Picea abies (L.) Karst., in southern Norway and recorded temperatures at various litter depths throughout the day. A second objective was to understand better the thermal microenvironment of the forest litter in which many bark beetle species during the spring begin their dispersal or host-seeking flight.

Methods and Results

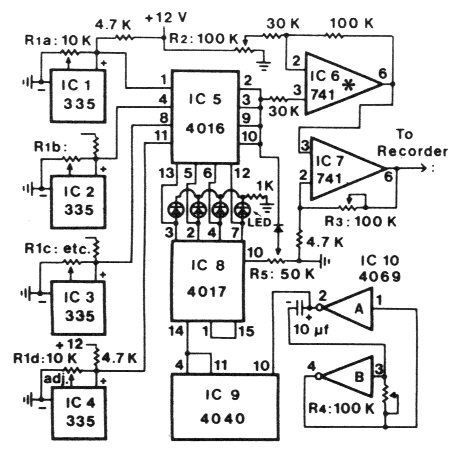
Thermometer and Multiplexing Circuit. The thermometer circuit (Fig. 1) uses four LM335 precision temperature sensors, each requiring three wires that connect to the control box (series resistance in long lead wires does not affect accuracy).
Fig. 1. Schematic of multiprobe thermometer and multiplexing circuit. *IC 6 and 7 each have +12 V at pin 7 and -12 V at pin 4 so a dual-polarity ±12 V power supply that is regulated is required (Carr 1978). ICs 5 and 10 have +12 V at pin 14 and ground at pin 7. Pins 5, 9, 11, and 13 of IC 10, pins 8 and 13 of IC 8, and pin 8 of IC 9 are connected to ground; pins 16 of ICs 8 and 9 are connected to +12 V. List of components: resistors, 0.25 watt, (1) 1 K Ohm, (5) 4.7 K Ohm, (2) 30 K Ohm, (1) 100 K Ohm; potentiometers, (4) 10 K Ohm trimmer, (1) 50 K Ohm, (2) 100 K Ohm, (1) l0-turn 100 K Ohm (R2); capacitors, (1) 10 µf; diodes, (1) IN4001, (2) red (1) yellow (1) green LEDs; integrated circuits, Iinear, (4) LM335, (2) LM741; COS/ MOS, (1) CD4016, (1) CD4017, (1) CD4090, (1) CD4069.
The metal leads from the probes can be water-proofed with a thin film of silicon glue. As many as eight temperature sensors can be incorporated by adding a second CD4016 integrated circuit (IC), connected in a similar way, and using the additional outputs of IC 8, pins 10, 1, 5, and 6 (plus additional light emitting diodes (LEDs). In this case, R5 as shown in Fig.1 would instead be connected to pin 9, and the reset pin 15 would be connected to pin 11. Scanning time per sensor probe can be adjusted via R4 of the oscillator circuit portion, as well as by selecting the appropriate output of IC 9 for connection to the input of IC 8. Pin 4 of IC 9 (Fig. 1) divides the input frequency at pin 10 by 27 or 128. Other frequency divisions for slower or faster scanning times can be performed by connecting pin 14 of IC 8 and pin 11 of IC 9 to one of the Eollowing pins of IC 9: 9, 7, 6, 5, 3, 2, 4, 13, 12, 14, 15, or 1 (division by 21-212, respectively).

A one-time calibration of the thermometer is done by first equilibrating the individual probes (ICs 1-4) by measuring with a VOM meter the output voltage from each LM335 (at pins 1, 4, 8, and 11 of IC 5) and adjusting each 10 K Ohm trimmer potentiometer (R1a-d) until they all read in volts the ambient temperature in oC/100 + 2.732 (e.g., at 25oC the voltage should read 2.982 V ). The probes are then cooled to 0oC and the voltage output of IC 6, pin 6, should read 0 V (adjusted via R2, 100 K Ohm multiturn potentiometer). Finally, the probes are again placed at ambient (e.g., 25oC) and R3 is adjusted until the output of IC 7, pin 6, reads 2.5 V. The output voltage, as measured with the VOM meter, is then equivalent to the temperature in oC. R1a through d and R2 need be adjusted only once and thus should be protected inside the control box. R3, R4, and R5 should be accessible from the outside of the box for easy adjustment. If reproducible scanning times are desired, R4 can be replaced with a 12-pole rotary switch with different resistors. Alternatively, the 12-pole switch can be connected between the various outputs of IC 9 and the input of IC 8.

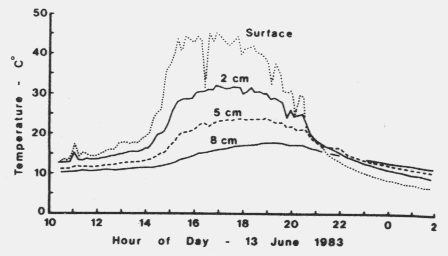
Forest Litter Temperatures. The thermometer was used to measure temperatures in forest litter of Norway spruce on three sunny and "warm" days during the spring swarming period of the bark beetle, Ips typographus (L.). The probes measured temperatures at the surface and at 2.5- and 10-cm depths on 10-11 and 12-13 June; and at 2-, 5-, and 8-cm depths during 13-14 June 1983 (Fig. 2) in southern Norway 15 km NNE of Skien. The metal "legs" from the thermometer probes were taped to a 9 cm by 0.3 cm diameter wooden spruce twig at the designated spacings, inserted to the appropriate depth, and vibrated to settle the perturbed litter.

Fig. 2. Temperatures of forest litter of Norway spruce at the surface and at three depths during the day as recorded by the electronic thermometers (air temperature at 1 m was about 23oC at 1600 h). The sharp rise in surface tempcrature was due to the sun passing over the trees which had shaded the ground, and the decline is due to the sun setting below the opposite mountain. Sharp changes in surface temperature were due to occnssional clouds blocking the sunlight.
The probe on the surface rested on the needles, with the probe's upper surface about 3 mm above the needles and exposed to the sun. At least one day later, the thermometers were connected to a one-pen chart recorder for record- ing throughout the day.

The litter consisted of dried whole spruce needles for 2 or 3 cm and then graded into increasing amounts of organic debris mixed with dried spruce needles. At about 5.5 cm the litter appeared "damp," indicating a RH near 100%, while at between 0 and 2 cm the litter appeared very dry and sun-baked. The recording site was 2 m from the nearest spruce tree and was situated on the edge of an even-aged (50-70 years), nearly pure spruce forest with a few scattered Scots pine, Pinus silvestris L.

As expected, the surface temperature was rapidly affected by the amount of insolation and was the most variable (Fig. 2). The average temperature during the scanning period for each probe (116.25 s) was plotted in Fig. 2; however, fluctuations in temperature during these periods were recorded at each level. The changes in temperature within each period between 1500 and 2000 h (n = 32) ranged up to 5.4o at the surface (avg. variation = 2.2 ± 0.4o, ± 95% confidence limits); 1.2o at 2 cm depth (avg. = 0.6 ± 0.1o); 0.4o at 5 cm (avg. = 0.1 ± 0.05o); and <0.2o at 8 cm. The daily temperature maximum at each depth was shifted to a later time with increasing depth (Fig. 2). This shift agrees with predictions from mathematical models of soil temperature (Campbell 1977).

One property of the forest litter microenvironment which is important for survival of bark beetles, the thermal diffusivity (the ratio of thermal conductivity to volumetric specific heat), was calculated from the daily fluctuations in temperature at the surface and various depths (Table 1).
Table 1. Daily temperature fluctuations at several depths in Norway spruce foret litter during three deys in June 1983 in southern Norway
Daily temp. fluctuations (oC)
June
Litter
depth
10-1112-1313-14
Sufrace±19.6±19.6±19.6
2 cm--±12.2
2.5 cm±10.9±10.4-
5 cm--±7/6
8 cm--±3.9
10 cm±1.5±1.0-


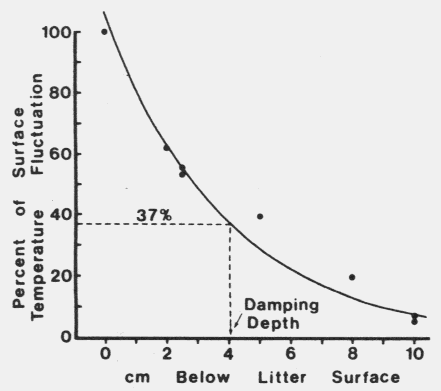
Fig. 3. Daily temperature fluctuations as percentages of surface temperature fluctuations in relation to Norway spruce litter depth.
An exponential regression of these values (Fig. 3) as a percentage of the value at the surface (y) against the corresponding depths (x) yielded the following equation: y =106.33e-0.26X, r2 = 0.96. This was used to determine the damping depth (D), the depth at which fluctuations are 37% as great as those at the surface. In my study, D = 4.056 cm (Campbell 1977). The thermal diffusivity of spruce Iitter, K, is then K = D2w/2 = 0.06 mm2/s, where w = 2(3.141593)/86.400 s = 7.3 x 10⁻⁵/s.


Discussion

Thermometer and Multiplexing Circuit. The precision temperature sensor LM335 has an exceptionally linear output as a function of temperature, in comparison with other sensors such as thermocouples or thermistors (Linear Databook 1982, National Semiconductor Corp.). The LM335 sensor has a typical error, over a l00oC range, of only about 0.5o. The sensor operates well from -40 to 100oC, and the LM135 will operate from -55 to 150o. The small size of the sensor probe (3 by 4 by 5 mm), the size of a plastic transistor, allows for a comparatively fast response to temperature. Although many thermocouple probes have a faster response, the LM335 may be more suitable for microenvironment temperature measurement because its size is similar to that of a bark beetle.

Each of the sensors is sequentially eonnected to the amplifier portion (IC 6 and 7) by a quad bilateral switch (IC 5). The four switches are independent and each is controlled by an input signal at the respective control pins (13, 5, 6, and 12). Only one switch is "on" at a particular time, according to the timer and eontrol circuit consisting of ICs 8, 9, and 10. IC 10 consists of six inverter circuits, only two of which are used, and forms an oscillator or "clock" for controlling the scanning time. R4 can be adjusted to a minimum of about 1 Kf1 (but not OSt) producing 0.015-s periods. The pulse frequency is then divided by IC 9, a ripple-carry binary counter, into the desired rate by selecting the appropriate output for connection to IC 8. With IC 9 it is possible to multiply the oscillation period from IC 10 by any of 12 orders of magnitude from 21 to 212 (in whole exponents, as described above), such that the shortest scanning time would be about 0.03 s and the longest 1 h. However, all possible times up to 1 h can be attained because of the possibility of adjusting R4 in addition to selecting the output of IC 9. The pulse from IC 9 then "clocks" IC 8, a decade counter, so that each output 3, 2, 4, and 7 goes "high" in sequence and turns on both the respective LED and the switch in IC 5. Other complementary metal oxide semiconductor (COS/MOS) compatible timers could be used in place of ICs 9 and 10 when either exact time periods of predetermined duration or synchronized real-time periods are required, e.g., a fraction collector timer based on the 50 or 60 Hz AC power line described recently by Byers (1983).

The voltage from a sensor passes through the switch in IC 5 and is fed to the input of IC 6, which acts as a difference amplifier (Vout, at pin 6 = Vin at pin 3 - Vin, at pin 2). The output voltage is then connected to IC 7, which acts as a noninverting amplifier in which amplification is controlled by R3. The temperature sensor and amplifier circuit portion is similar to that described by Byers and Poinar (1982), but the sensor IC is more accurate than the LM334 used previously. Since the output voltage of IC 7 corresponds to the temperature in oC/100, a voltmeter and/or strip chart recorder of appropriate voltage scale can be used to record temperatures. The circuit (Fig. 1) uses about 23 mA (+) and 3 mA (-) so a portable dual battery supply (regulated ±12 V) is feasible for use in the field. The circuit can in principle be used for measurement and recording of signals from multiple sensors as diverse as solar cells or digital/analog converters that produce voltages.

Forest Litter Temperatures. Many species of bark beetle and other insects overwinter in the protected environment of forest litter where severe winter temperatures and conditions are buffered and ameliorated by the blanket of snow, as well as by the insulating properties of the litter itself. Among the relatively common bark beetle species occurring in spruce/pine forests in southern Norway (Lekander et al. 1977), approximately. 13 hibernate in spruce and 8 hibernate in the litter (including I. typographus). In pine forests, two species hibernate in the tree, two in the litter, and two in both (three unknown). Additionally, there are five bark beetle species that infest both species of tree; three hibernate in the trees while the other two may hibernate in either the trees or litter.

Among the bark beetle species which overwin- ter in the forest litter, practically all begin flight in May and early June (although Tomicus minor leaves in April and May, Dryocoetes sp. in June, and Hylurgops glabratus in late June or July). During 1983 at the study area, most I. typographus were caught in traps releasing pheromone components (5 mg 2-methyl-3-butene-2-ol per day and 0.1 mg (s)-cis-verbenol per day) primarily in early June, including the first two dates of temperature recording; few were caught after 14 June (unpublished data).

The value calculated for the thermal diffusivity, K, of the spruce litter (0.06 mm2/s) is about the same as that for peat (0.1 mm2/s). This seems reasonable because of similar characteristics of density, porosity, and high organic content. Compared to clay or sand which have K values that range from 0.18 mm2/s (little water) to between 0.4 and 0.8 mm2/s (increasing water content, peat K does not vary with water content and peat is a relatively poor conductor of heat, i.e., a good insulator (Baver et al. 1972). This also appears to be true of spruce litter, and thus would allow steep thermal gradients during the spring, in which beetles could quickly move to their preferred temperature.

I. typographus, the spruce bark beetle, is the major pest of Norway spruce and is very common throughout Scandinavia, Europe, and Asia. In 1979 over four billion beetles were caught in several hundred thousand pheromone traps in Norwegian and Swedish forests (Lie and Bakke 1981). During early May, when the snow cover melts and temperatures in the litter begin to rise from near Oo to 1Oo or more, I. typographus continues to mature and may feed on pieces of bark, branches, and scales of cones (Annila 1969). The beetles can move slowly between 5 and 10.5oC, with normal movement above l4oC (Vité 1952). Annila (1969) found that I. typographus can move slowly even at Oo and certainly at 5oC. Feeding does not occur below 5o (Annila 1969) or 7o (Merker 1957) while Merker and Wild (1954) suggest that continuous feeding requires temperatures of 12oC or more. During May and early June in southern Norway and mid-Sweden, the beetles emerge from the litter and attempt to fly, with peak activity at 1400 h, influenced by temperature (Annila 1969) and possibly photoperiod (Byers 1983).

The threshold temperature for flight initiation in I. typographus is about 17.5oC (Merker 1957); although most require 22 or 23oC (Annila 1969) for take-offs within a reasonable period (30 min). These thermal requirements appear similar for I. sexdentatus and I. acuminatus (18oC), but T. minor needs only 12 or l4oC (Bakke 1968). Once I. typographus is in flight, however, the temperature needed to sustain flight may be as low as l4oC (Chararas 1959). Annila (1969) stated that I. typographus will swarm when the air temperature is about 20oC and that of the litter layer (at 7 cm depth) 10 or l2oC. It is more relevant, however, to measure the temperature near the surface (where beetles are taking off) and the air temperature in order to determine if swarming will occur. In Fig. 2 the surface temperature is well above the threshold for take-off and at times even higher than the optimal temperature (28-3loC, unpublished data). In fact, at 44oC beetles will die within 2 min if they do not either fly to the cooler air (23oC) or return to the depths below to recuperate (Fig. 2). Swarming does not depend entirely upon surface/air temperatures, but requires in addition a minimum of between 110 and 130 degree-days > 5oC for maturation before it can begin (Annila 1969). The daily maximum temperature at 7 cm depth was measured continuously by Annila (1969) in Finland from May to late June 1966. He found that the temperature was 1 or 2oC until about 10 May and then rose to 10oC by mid-May, was relatively stable until early June, and then gradually increased to 20oC by late June. These values agree with those shown in Fig. 2 for the same date as well as on the two earlier dates.

Further work is needed to determine the distribution of overwintering hibernacula and on the hidden movements of bark beetles at various depths in relation to temperature during their preparation for swarming.

JOHN A. BYERS

Department of Ecology, Animal Ecology, Lund University, SE-223 62 Lund, Sweden

Present address:

Acknowledgement
I gratefully acknowledge support for this work by the Swedish research project "Odour signals for control of pest insccts," which is funded by the Swedish Research Councils: NFR, FRN, and SJFR.

References Cited
Annila, E. 1969. Influence oE temperature upon the development and voltinism of Ips typographus L. (Coleoptera, Scolytidae). Ann. Zool. Fenn. 6: 161-207.

Bakke, A. 1968. Ecological studies on bark beetles (Coleoptera: Scolytidae) associated with Scots pine (Pinus sylvestris L.) in Norway with particular reference to the influence of temperature. Medd. Nor. Skogforsoksves. 21: 441-602.

Baver, L. D., W. H. Gardner, and W. R. Gardner. 1972. Soil physics. 7. The thermal regime of soils, pp. 253-280. 4th ed. John Wiley and Sons, New York.

Byers, J. A. 1983. Electronic fraction collector used for inscct sampling in the photoperiod-induced diel emergence of bark beetles. Physiol. Entomol. 8:133-138.

Byers, J. A., and G. O. Poiner, Jr. 1982. Location of insect hosts by the nematode, Neoaplectana carpocapsae, in response to temperature. Behaviour 79: 1-10.

Campbell, G. S. 1977. An introduction to environmental biophysics, 2. Temperature, pp. I6-17. Springer-Verlag, New York.

Carr J. 1978. How to design and build power supplies. Pop. Electron. (May): 61-64.

Chareras, C. 1959. L'influence des conditions climatiques sur l'évolution des Scolytides. Ann. Ec. Nat. Eaux For. (Nancy) 16: 135-167.

Lekander, B., B. Bejer-Petersen, E. Kangas, and A. Bakke. 1977. The distribution of bark beetles in the Nordic countries. Acta Entomol. Fenn. 32: 1-37.

Lie, R., and A. Bakke. 1981. Practical results from the mass trapping of Ips typographus in Scandinavia, pp. 175-181. In E. R. Mitchell [ed.], Management of insect pests with semiochemicals. Plenum, New York.

Merker, E. 1957. Die ökologischen Ursachen der Massenvermehcung des grossen Fichtenborkenkäfers in Südwestdeutschland während der Jahre 1941 bis 1951. Freiburg.

Merker, E., and M. Wild. 1954. Das Reifen der Geschlechtsdrüsen bei dem grossen Fichtenborkenkäfer und sein Einfluss auf das Verhalten der Tiere. Beitr. Entomol. 4: 451-468.

Vité, ). P. 1952. Temperaturversuche an Ips typographus L. Zool. Anz. 149: 195-206.
home page